
 Backend Development
Python Tutorial
[Python-CVImage Segmentation : Canny Edges, Watershed, and K-Means Methods
Backend Development
Python Tutorial
[Python-CVImage Segmentation : Canny Edges, Watershed, and K-Means Methods
[Python-CVImage Segmentation : Canny Edges, Watershed, and K-Means Methods
Dec 11, 2024 am 05:33 AM
Segmentation is a fundamental technique in image analysis that allows us to divide an image into meaningful parts based on objects, shapes, or colors. It plays a pivotal role in applications such as object detection, computer vision, and even artistic image manipulation. But how can we achieve segmentation effectively? Fortunately, OpenCV (cv2) provides several user-friendly and powerful methods for segmentation.
In this tutorial, we’ll explore three popular segmentation techniques:
- Canny Edge Detection – perfect for outlining objects.
- Watershed Algorithm – great for separating overlapping regions.
- K-Means Color Segmentation – ideal for clustering similar colors in an image.
To make this tutorial engaging and practical, we’ll use satellite and aerial images from Osaka, Japan, focusing on the ancient kofun burial mounds. You can download these images and the corresponding sample notebook from the tutorial's GitHub page.
Canny Edge Detection to Contour Segmentation
Canny Edge Detection is a straightforward yet powerful method to identify edges in an image. It works by detecting areas of rapid intensity change, which are often boundaries of objects. This technique generates "thin edge" outlines by applying intensity thresholds. Let’s dive into its implementation using OpenCV.
Example: Detecting Edges in a Satellite Image
Here, we use a satellite image of Osaka, specifically a kofun burial mound, as a test case.
import cv2
import numpy as np
import matplotlib.pyplot as plt
files = sorted(glob("SAT*.png")) #Get png files
print(len(files))
img=cv2.imread(files[0])
use_image= img[0:600,700:1300]
gray = cv2.cvtColor(use_image, cv2.COLOR_BGR2GRAY)

#Stadard values
min_val = 100
max_val = 200
# Apply Canny Edge Detection
edges = cv2.Canny(gray, min_val, max_val)
#edges = cv2.Canny(gray, min_val, max_val,apertureSize=5,L2gradient = True )
False
# Show the result
plt.figure(figsize=(15, 5))
plt.subplot(131), plt.imshow(cv2.cvtColor(use_image, cv2.COLOR_BGR2RGB))
plt.title('Original Image'), plt.axis('off')
plt.subplot(132), plt.imshow(gray, cmap='gray')
plt.title('Grayscale Image'), plt.axis('off')
plt.subplot(133), plt.imshow(edges, cmap='gray')
plt.title('Canny Edges'), plt.axis('off')
plt.show()

The output edges clearly outline parts of the kofun burial mound and other regions of interest. However, some areas are missed due to the sharp thresholding. The results depend heavily on the choice of min_val and max_val, as well as the image quality.
To enhance edge detection, we can preprocess the image to spread out pixel intensities and reduce noise. This can be achieved using histogram equalization (cv2.equalizeHist()) and Gaussian blurring (cv2.GaussianBlur()).
use_image= img[0:600,700:1300]
gray = cv2.cvtColor(use_image, cv2.COLOR_BGR2GRAY)
gray_og = gray.copy()
gray = cv2.equalizeHist(gray)
gray = cv2.GaussianBlur(gray, (9, 9),1)

plt.figure(figsize=(15, 5))
plt.subplot(121), plt.imshow(gray, cmap='gray')
plt.title('Grayscale Image')
plt.subplot(122)
_= plt.hist(gray.ravel(), 256, [0,256],label="Equalized")
_ = plt.hist(gray_og.ravel(), 256, [0,256],label="Original",histtype='step')
plt.legend()
plt.title('Grayscale Histogram')
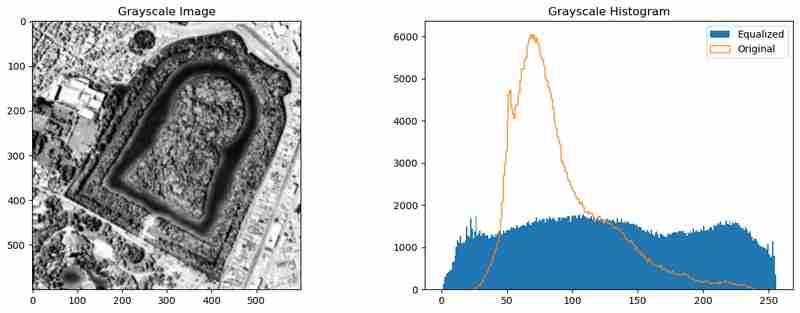
This preprocessing evens out the intensity distribution and smooths the image, which helps the Canny Edge Detection algorithm capture more meaningful edges.
Edges are useful, but they only indicate boundaries. To segment enclosed areas, we convert edges into contours and visualize them.
# Edges to contours
contours, hierarchy = cv2.findContours(edges, cv2.RETR_TREE, cv2.CHAIN_APPROX_SIMPLE)
# Calculate contour areas
areas = [cv2.contourArea(contour) for contour in contours]

# Normalize areas for the colormap
normalized_areas = np.array(areas)
if normalized_areas.max() > 0:
    normalized_areas = normalized_areas / normalized_areas.max()

# Create a colormap
cmap = plt.cm.jet

# Plot the contours with the color map
plt.figure(figsize=(10, 10))
plt.subplot(1,2,1)
plt.imshow(gray, cmap='gray', alpha=0.5)  # Display the grayscale image in the background
mask = np.zeros_like(use_image)
for contour, norm_area in zip(contours, normalized_areas):
    color = cmap(norm_area)  # Map the normalized area to a color
    color = [int(c*255) for c in color[:3]]
    cv2.drawContours(mask, [contour], -1, color,-1 )  # Draw contours on the image

plt.subplot(1,2,2)
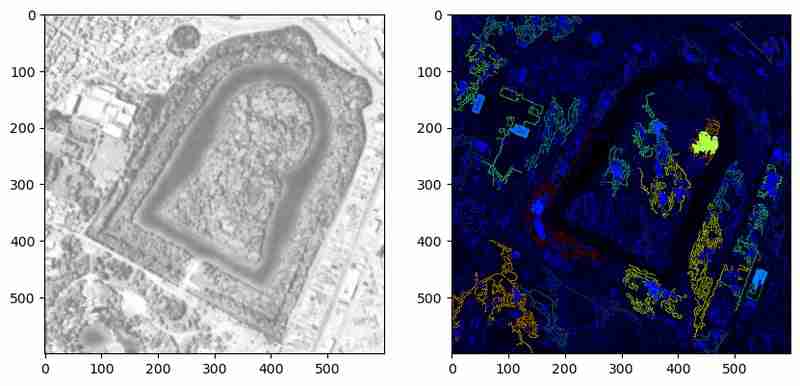
The above method highlights detected contours with colors representing their relative areas. This visualization helps verify if the contours form closed bodies or merely lines. However, in this example, many contours remain unclosed polygons. Further preprocessing or parameter tuning could address these limitations.
By combining preprocessing and contour analysis, Canny Edge Detection becomes a powerful tool for identifying object boundaries in images. However, it works best when objects are well-defined and noise is minimal. Next, we’ll explore K-Means Clustering to segment the image by color, offering a different perspective on the same data.
KMean Clustering
K-Means Clustering is a popular method in data science for grouping similar items into clusters, and it’s particularly effective for segmenting images based on color similarity. OpenCV's cv2.kmeans function simplifies this process, making it accessible for tasks like object segmentation, background removal, or visual analysis.
In this section, we will use K-Means Clustering to segment the kofun burial mound image into regions of similar colors.
To start, we apply K-Means Clustering on the RGB values of the image, treating each pixel as a data point.
import cv2
import numpy as np
import matplotlib.pyplot as plt
files = sorted(glob("SAT*.png")) #Get png files
print(len(files))
img=cv2.imread(files[0])
use_image= img[0:600,700:1300]
gray = cv2.cvtColor(use_image, cv2.COLOR_BGR2GRAY)

#Stadard values
min_val = 100
max_val = 200
# Apply Canny Edge Detection
edges = cv2.Canny(gray, min_val, max_val)
#edges = cv2.Canny(gray, min_val, max_val,apertureSize=5,L2gradient = True )
False
# Show the result
plt.figure(figsize=(15, 5))
plt.subplot(131), plt.imshow(cv2.cvtColor(use_image, cv2.COLOR_BGR2RGB))
plt.title('Original Image'), plt.axis('off')
plt.subplot(132), plt.imshow(gray, cmap='gray')
plt.title('Grayscale Image'), plt.axis('off')
plt.subplot(133), plt.imshow(edges, cmap='gray')
plt.title('Canny Edges'), plt.axis('off')
plt.show()
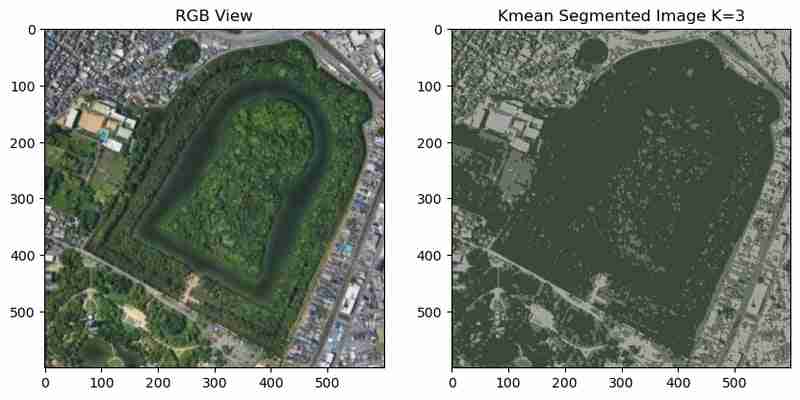
In the segmented image, the burial mound and surrounding regions are clustered into distinct colors. However, noise and small variations in color lead to fragmented clusters, which can make interpretation challenging.
To reduce noise and create smoother clusters, we can apply a median blur before running K-Means.
use_image= img[0:600,700:1300]
gray = cv2.cvtColor(use_image, cv2.COLOR_BGR2GRAY)
gray_og = gray.copy()
gray = cv2.equalizeHist(gray)
gray = cv2.GaussianBlur(gray, (9, 9),1)

plt.figure(figsize=(15, 5))
plt.subplot(121), plt.imshow(gray, cmap='gray')
plt.title('Grayscale Image')
plt.subplot(122)
_= plt.hist(gray.ravel(), 256, [0,256],label="Equalized")
_ = plt.hist(gray_og.ravel(), 256, [0,256],label="Original",histtype='step')
plt.legend()
plt.title('Grayscale Histogram')
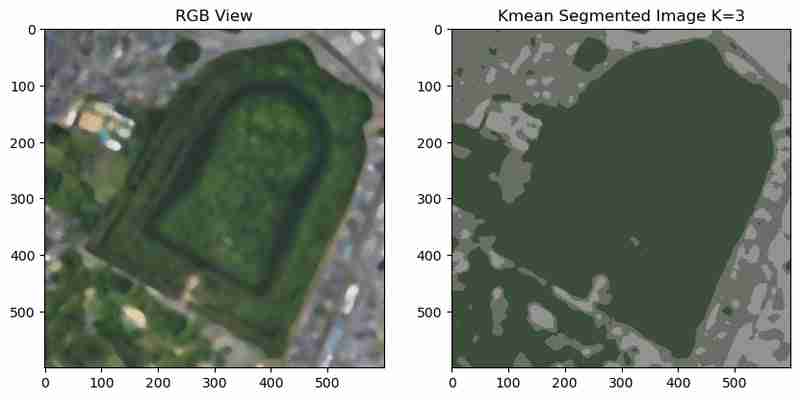
The blurred image results in smoother clusters, reducing noise and making the segmented regions more visually cohesive.
To better understand the segmentation results, we can create a color map of the unique cluster colors, using matplotlib plt.fill_between;
# Edges to contours
contours, hierarchy = cv2.findContours(edges, cv2.RETR_TREE, cv2.CHAIN_APPROX_SIMPLE)
# Calculate contour areas
areas = [cv2.contourArea(contour) for contour in contours]

# Normalize areas for the colormap
normalized_areas = np.array(areas)
if normalized_areas.max() > 0:
    normalized_areas = normalized_areas / normalized_areas.max()

# Create a colormap
cmap = plt.cm.jet

# Plot the contours with the color map
plt.figure(figsize=(10, 10))
plt.subplot(1,2,1)
plt.imshow(gray, cmap='gray', alpha=0.5)  # Display the grayscale image in the background
mask = np.zeros_like(use_image)
for contour, norm_area in zip(contours, normalized_areas):
    color = cmap(norm_area)  # Map the normalized area to a color
    color = [int(c*255) for c in color[:3]]
    cv2.drawContours(mask, [contour], -1, color,-1 )  # Draw contours on the image

plt.subplot(1,2,2)
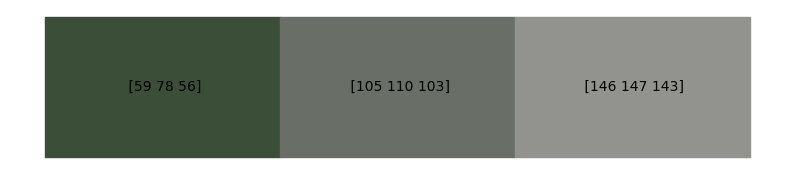
This visualization provides insight into the dominant colors in the image and their corresponding RGB values, which can be useful for further analysis. AS we could mask and select area my color code now.
The number of clusters (K) significantly impacts the results. Increasing K creates more detailed segmentation, while lower values produce broader groupings. To experiment, we can iterate over multiple K values.
import cv2
import numpy as np
import matplotlib.pyplot as plt
files = sorted(glob("SAT*.png")) #Get png files
print(len(files))
img=cv2.imread(files[0])
use_image= img[0:600,700:1300]
gray = cv2.cvtColor(use_image, cv2.COLOR_BGR2GRAY)

#Stadard values
min_val = 100
max_val = 200
# Apply Canny Edge Detection
edges = cv2.Canny(gray, min_val, max_val)
#edges = cv2.Canny(gray, min_val, max_val,apertureSize=5,L2gradient = True )
False
# Show the result
plt.figure(figsize=(15, 5))
plt.subplot(131), plt.imshow(cv2.cvtColor(use_image, cv2.COLOR_BGR2RGB))
plt.title('Original Image'), plt.axis('off')
plt.subplot(132), plt.imshow(gray, cmap='gray')
plt.title('Grayscale Image'), plt.axis('off')
plt.subplot(133), plt.imshow(edges, cmap='gray')
plt.title('Canny Edges'), plt.axis('off')
plt.show()

The clustering results for different values of K reveal a trade-off between detail and simplicity:
?Lower K values (e.g., 2-3): Broad clusters with clear distinctions, suitable for high-level segmentation.
?Higher K values (e.g., 12-15): More detailed segmentation, but at the cost of increased complexity and potential over-segmentation.
K-Means Clustering is a powerful technique for segmenting images based on color similarity. With the right preprocessing steps, it produces clear and meaningful regions. However, its performance depends on the choice of K, the quality of the input image, and the preprocessing applied. Next, we’ll explore the Watershed Algorithm, which uses topographical features to achieve precise segmentation of objects and regions.
Watershed Segmentation
The Watershed Algorithm is inspired by topographic maps, where watersheds divide drainage basins. This method treats grayscale intensity values as elevation, effectively creating "peaks" and "valleys." By identifying regions of interest, the algorithm can segment objects with precise boundaries. It’s particularly useful for separating overlapping objects, making it a great choice for complex scenarios like cell segmentation, object detection, and distinguishing densely packed features.
The first step is preprocessing the image to enhance the features, followed by applying the Watershed Algorithm.
use_image= img[0:600,700:1300]
gray = cv2.cvtColor(use_image, cv2.COLOR_BGR2GRAY)
gray_og = gray.copy()
gray = cv2.equalizeHist(gray)
gray = cv2.GaussianBlur(gray, (9, 9),1)

plt.figure(figsize=(15, 5))
plt.subplot(121), plt.imshow(gray, cmap='gray')
plt.title('Grayscale Image')
plt.subplot(122)
_= plt.hist(gray.ravel(), 256, [0,256],label="Equalized")
_ = plt.hist(gray_og.ravel(), 256, [0,256],label="Original",histtype='step')
plt.legend()
plt.title('Grayscale Histogram')
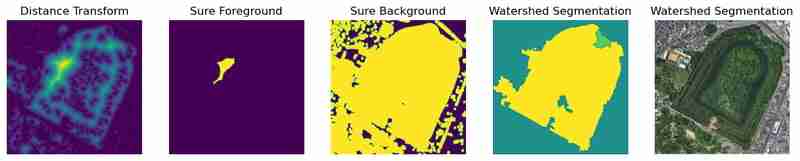
The segmented regions and boundaries can be visualized alongside intermediate processing steps.
# Edges to contours
contours, hierarchy = cv2.findContours(edges, cv2.RETR_TREE, cv2.CHAIN_APPROX_SIMPLE)
# Calculate contour areas
areas = [cv2.contourArea(contour) for contour in contours]

# Normalize areas for the colormap
normalized_areas = np.array(areas)
if normalized_areas.max() > 0:
    normalized_areas = normalized_areas / normalized_areas.max()

# Create a colormap
cmap = plt.cm.jet

# Plot the contours with the color map
plt.figure(figsize=(10, 10))
plt.subplot(1,2,1)
plt.imshow(gray, cmap='gray', alpha=0.5)  # Display the grayscale image in the background
mask = np.zeros_like(use_image)
for contour, norm_area in zip(contours, normalized_areas):
    color = cmap(norm_area)  # Map the normalized area to a color
    color = [int(c*255) for c in color[:3]]
    cv2.drawContours(mask, [contour], -1, color,-1 )  # Draw contours on the image

plt.subplot(1,2,2)
The algorithm successfully identifies distinct regions and draws clear boundaries around objects. In this example, the kofun burial mound is segmented accurately. However, the algorithm’s performance depends heavily on preprocessing steps like thresholding, noise removal, and morphological operations.
Adding advanced preprocessing, such as histogram equalization or adaptive blurring, can further enhance the results. For instance:
# Kmean color segmentation
use_image= img[0:600,700:1300]
#use_image = cv2.medianBlur(use_image, 15)


 # Reshape image for k-means
pixel_values = use_image.reshape((-1, 3)) if len(use_image.shape) == 3 else use_image.reshape((-1, 1))
pixel_values = np.float32(pixel_values)

criteria = (cv2.TERM_CRITERIA_EPS + cv2.TERM_CRITERIA_MAX_ITER, 10, 1.0)
K = 3
attempts=10
ret,label,center=cv2.kmeans(pixel_values,K,None,criteria,attempts,cv2.KMEANS_PP_CENTERS)

centers = np.uint8(center)
segmented_data = centers[label.flatten()]
segmented_image = segmented_data.reshape(use_image.shape)

plt.figure(figsize=(10, 6))
plt.subplot(1,2,1),plt.imshow(use_image[:,:,::-1])
plt.title("RGB View")
plt.subplot(1,2,2),plt.imshow(segmented_image[:,:,[2,1,0]])
plt.title(f"Kmean Segmented Image K={K}")

With these adjustments, more regions can be accurately segmented, and noise artifacts can be minimized.
The Watershed Algorithm excels in scenarios requiring precise boundary delineation and separation of overlapping objects. By leveraging preprocessing techniques, it can handle even complex images like the kofun burial mound region effectively. However, its success depends on careful parameter tuning and preprocessing.
Conclusion
Segmentation is an essential tool in image analysis, providing a pathway to isolate and understand distinct elements within an image. This tutorial demonstrated three powerful segmentation techniques—Canny Edge Detection, K-Means Clustering, and Watershed Algorithm—each tailored for specific applications. From outlining the ancient kofun burial mounds in Osaka to clustering urban landscapes and separating distinct regions, these methods highlight the versatility of OpenCV in tackling real-world challenges.
Now go and apply some of there method to an application of your choose and comment and share the results. Also if you know any other simple segmentation methods please share too
The above is the detailed content of [Python-CVImage Segmentation : Canny Edges, Watershed, and K-Means Methods. For more information, please follow other related articles on the PHP Chinese website!

Hot AI Tools

Undress AI Tool
Undress images for free

Undresser.AI Undress
AI-powered app for creating realistic nude photos

AI Clothes Remover
Online AI tool for removing clothes from photos.

Clothoff.io
AI clothes remover

Video Face Swap
Swap faces in any video effortlessly with our completely free AI face swap tool!

Hot Article
Hot Tools

Notepad++7.3.1
Easy-to-use and free code editor

SublimeText3 Chinese version
Chinese version, very easy to use

Zend Studio 13.0.1
Powerful PHP integrated development environment

Dreamweaver CS6
Visual web development tools

SublimeText3 Mac version
God-level code editing software (SublimeText3)
Hot Topics


 Polymorphism in python classes
Jul 05, 2025 am 02:58 AM
Polymorphism in python classes
Jul 05, 2025 am 02:58 AM
Polymorphism is a core concept in Python object-oriented programming, referring to "one interface, multiple implementations", allowing for unified processing of different types of objects. 1. Polymorphism is implemented through method rewriting. Subclasses can redefine parent class methods. For example, the spoke() method of Animal class has different implementations in Dog and Cat subclasses. 2. The practical uses of polymorphism include simplifying the code structure and enhancing scalability, such as calling the draw() method uniformly in the graphical drawing program, or handling the common behavior of different characters in game development. 3. Python implementation polymorphism needs to satisfy: the parent class defines a method, and the child class overrides the method, but does not require inheritance of the same parent class. As long as the object implements the same method, this is called the "duck type". 4. Things to note include the maintenance
 How do I write a simple 'Hello, World!' program in Python?
Jun 24, 2025 am 12:45 AM
How do I write a simple 'Hello, World!' program in Python?
Jun 24, 2025 am 12:45 AM
The "Hello,World!" program is the most basic example written in Python, which is used to demonstrate the basic syntax and verify that the development environment is configured correctly. 1. It is implemented through a line of code print("Hello,World!"), and after running, the specified text will be output on the console; 2. The running steps include installing Python, writing code with a text editor, saving as a .py file, and executing the file in the terminal; 3. Common errors include missing brackets or quotes, misuse of capital Print, not saving as .py format, and running environment errors; 4. Optional tools include local text editor terminal, online editor (such as replit.com)
 How do I generate random strings in Python?
Jun 21, 2025 am 01:02 AM
How do I generate random strings in Python?
Jun 21, 2025 am 01:02 AM
To generate a random string, you can use Python's random and string module combination. The specific steps are: 1. Import random and string modules; 2. Define character pools such as string.ascii_letters and string.digits; 3. Set the required length; 4. Call random.choices() to generate strings. For example, the code includes importrandom and importstring, set length=10, characters=string.ascii_letters string.digits and execute ''.join(random.c
 What are algorithms in Python, and why are they important?
Jun 24, 2025 am 12:43 AM
What are algorithms in Python, and why are they important?
Jun 24, 2025 am 12:43 AM
AlgorithmsinPythonareessentialforefficientproblem-solvinginprogramming.Theyarestep-by-stepproceduresusedtosolvetaskslikesorting,searching,anddatamanipulation.Commontypesincludesortingalgorithmslikequicksort,searchingalgorithmslikebinarysearch,andgrap
 What is list slicing in python?
Jun 29, 2025 am 02:15 AM
What is list slicing in python?
Jun 29, 2025 am 02:15 AM
ListslicinginPythonextractsaportionofalistusingindices.1.Itusesthesyntaxlist[start:end:step],wherestartisinclusive,endisexclusive,andstepdefinestheinterval.2.Ifstartorendareomitted,Pythondefaultstothebeginningorendofthelist.3.Commonusesincludegetting
 Python `@classmethod` decorator explained
Jul 04, 2025 am 03:26 AM
Python `@classmethod` decorator explained
Jul 04, 2025 am 03:26 AM
A class method is a method defined in Python through the @classmethod decorator. Its first parameter is the class itself (cls), which is used to access or modify the class state. It can be called through a class or instance, which affects the entire class rather than a specific instance; for example, in the Person class, the show_count() method counts the number of objects created; when defining a class method, you need to use the @classmethod decorator and name the first parameter cls, such as the change_var(new_value) method to modify class variables; the class method is different from the instance method (self parameter) and static method (no automatic parameters), and is suitable for factory methods, alternative constructors, and management of class variables. Common uses include:
 How do I use the csv module for working with CSV files in Python?
Jun 25, 2025 am 01:03 AM
How do I use the csv module for working with CSV files in Python?
Jun 25, 2025 am 01:03 AM
Python's csv module provides an easy way to read and write CSV files. 1. When reading a CSV file, you can use csv.reader() to read line by line and return each line of data as a string list; if you need to access the data through column names, you can use csv.DictReader() to map each line into a dictionary. 2. When writing to a CSV file, use csv.writer() and call writerow() or writerows() methods to write single or multiple rows of data; if you want to write dictionary data, use csv.DictWriter(), you need to define the column name first and write the header through writeheader(). 3. When handling edge cases, the module automatically handles them
 Python Function Arguments and Parameters
Jul 04, 2025 am 03:26 AM
Python Function Arguments and Parameters
Jul 04, 2025 am 03:26 AM
Parameters are placeholders when defining a function, while arguments are specific values ??passed in when calling. 1. Position parameters need to be passed in order, and incorrect order will lead to errors in the result; 2. Keyword parameters are specified by parameter names, which can change the order and improve readability; 3. Default parameter values ??are assigned when defined to avoid duplicate code, but variable objects should be avoided as default values; 4. args and *kwargs can handle uncertain number of parameters and are suitable for general interfaces or decorators, but should be used with caution to maintain readability.
