

Monitor Redis Droplet with Redis Exporter Service
Apr 10, 2025 pm 01:36 PM
Effective monitoring of Redis databases is critical to maintaining optimal performance, identifying potential bottlenecks, and ensuring overall system reliability. Redis Exporter Service is a powerful utility designed to monitor Redis databases using Prometheus. This tutorial will guide you through the complete setup and configuration of Redis Exporter Service, ensuring you seamlessly build monitoring solutions. By studying this tutorial, you will achieve fully operational monitoring settings

Method 1: Manual configuration
We continue with the manual configuration method in this section.
Create Prometheus system users and groups
Create a system user and group "prometheus" named to manage the exporter
sudo groupadd --system prometheus
sudo useradd -s /sbin/nologin --system -g prometheus prometheus
Download and install Redis Exporter
Download the latest version of Redis Exporter downloaded files from GitHub and move the binary to the /usr/local/bin/ directory.
curl -s https://api.github.com/repos/oliver006/redis_exporter/releases/latest | grep browser_download_url | grep linux-amd64 | cut -d '"' -f 4 | wget -qi -
tar xvf redis_exporter-*.linux-amd64.tar.gz
sudo mv redis_exporter-*.linux-amd64/redis_exporter /usr/local/bin/
Verify Redis exporter installation
redis_exporter --version
Here is the sample output:

Configure systemd service for Redis Exporter
Create a systemd service unit file to manage Redis Exporter
sudo vim /etc/systemd/system/redis_exporter.service
Add the following to the file:
 [Unit]Description=Prometheus Redis ExporterDocumentation=https://github.com/oliver006/redis_exporterWants=network-online.targetAfter=network-online.target[Service]Type=simpleUser=prometheusGroup=prometheusExecReload=/bin/kill -HUP $MAINPIDExecStart=/usr/local/bin/redis_exporter
   --log-format=txt
   --namespace=redis
   --web.listen-address=:9121
   --web.telemetry-path=/metricsSyslogIdentifier=redis_exporterRestart=always[Install]WantedBy=multi-user.target
Reload systemd and start Redis Exporter service
sudo systemctl daemon-reload
sudo systemctl enable redis_exporter
sudo systemctl start redis_exporter
Configuring Prometheus Droplet (manual method)
Let's configure the Prometheous Droplet manually.
Backup the prometheus.yml file
cp /etc/prometheus/prometheus.yml /etc/prometheus/prometheus.yml-$(date '%d%b%Y-%H:%M')
Add Redis Exporter endpoint scraped
Log in to your Prometheus server and add the Redis Exporter endpoint to crawl.
Replace the IP address and port with your Redis Exporter endpoint (9121 is the default port for Redis Exporter service).
vi /etc/prometheus/prometheus.yml
 scrape_configs:
  - job_name: server1_db
    static_configs:
      - targets: ['10.10.1.10:9121']
        labels:
          alias: db1

  - job_name: server2_db
    static_configs:
      - targets: ['10.10.1.11:9121']
        labels:
Manual configuration ends here. Now, let's continue with script-based configuration.
Method 2: Use scripts to configure
You can also do this by running two scripts - one for the target Droplet and the other for the Prometheus Droplet.
Let's start by configuring the target Droplet.
Connect to the target Droplet via SSH.
Use the following command to download the target configuration script:
wget https://solutions-files.ams3.digitalocianspaces.com/Redis-Monitoring/DO_Redis_Target_Config.sh
After downloading the script, make sure it has executable permissions to run:
chmod x DO_Redis_Target_Config.sh
Execute the script by running the following command:
./DO_Redis_Target_Config.sh
Configuration
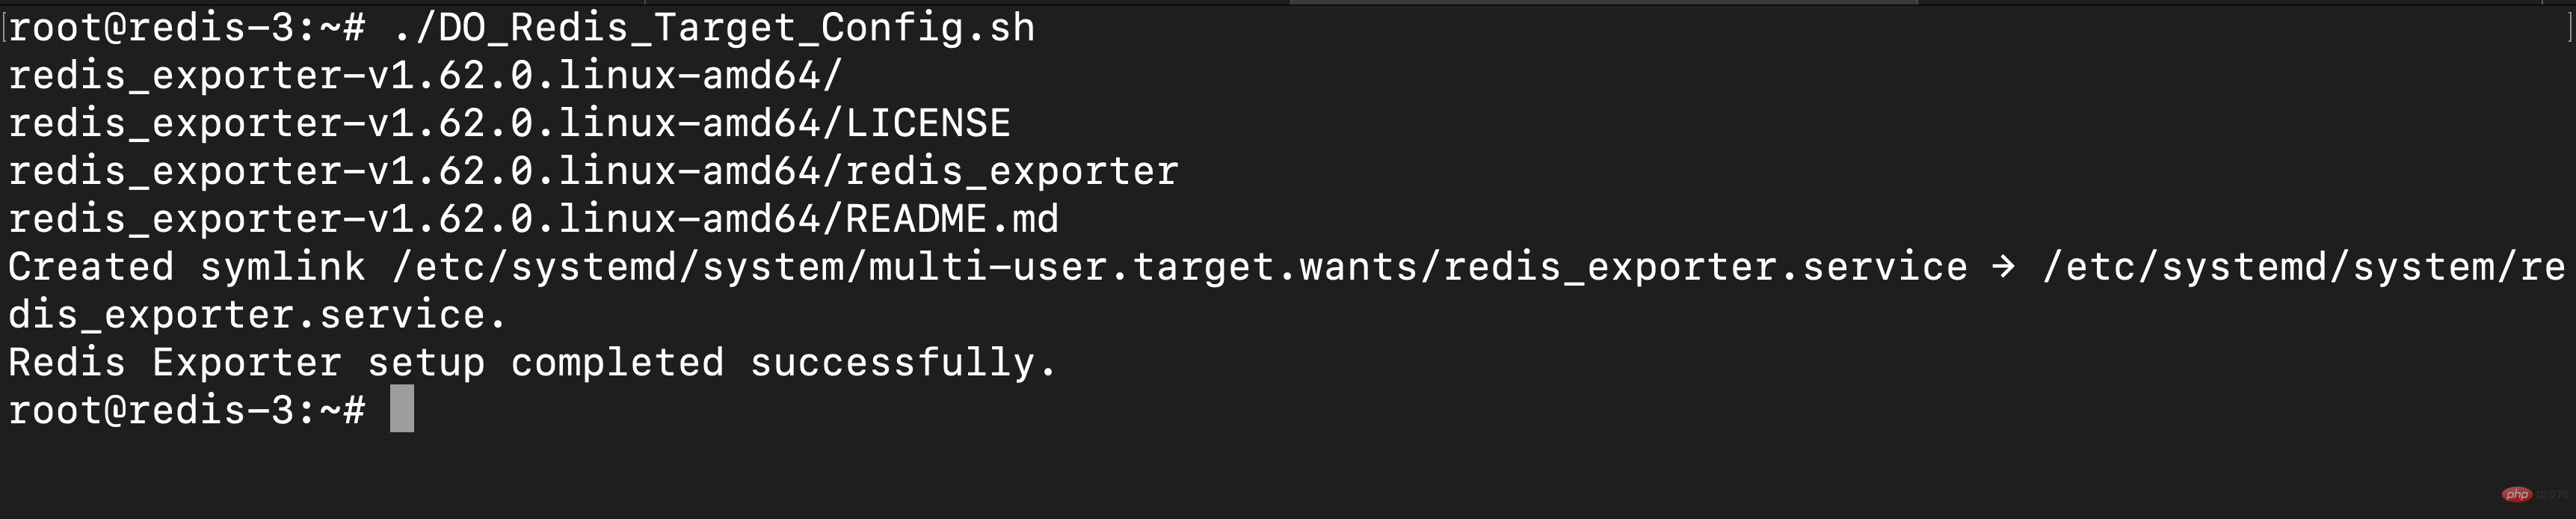
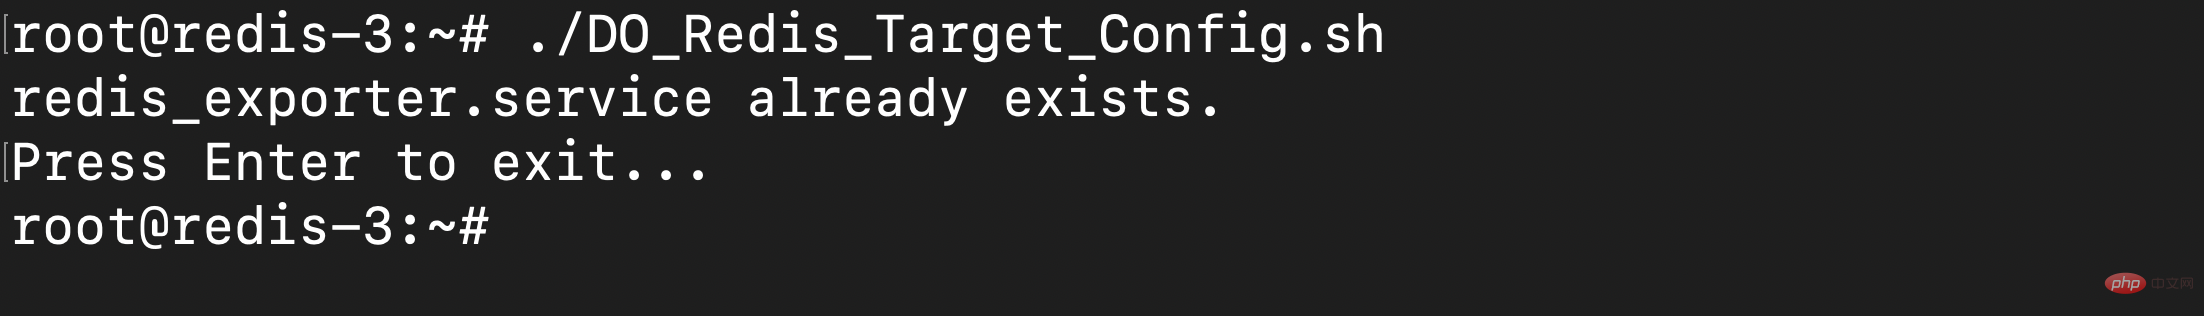
Note: If the redis_exporter.service file already exists, the script will not run.
Configure Prometheus Droplet (Script Method)
SSH to Prometheus Droplet and download the script using the following command:
wget https://solutions-files.ams3.digitalocianspaces.com/Redis-Monitoring/DO_Redis_Prometheus_Config.sh
After downloading the script, make sure it has executable permissions to run:
chmod x DO_Redis_Prometheus_Config.sh
Execute script running:
./DO_Redis_Prometheus_Config.sh
Enter the number of droplets to add to the monitoring.
Enter the host name and IP address.
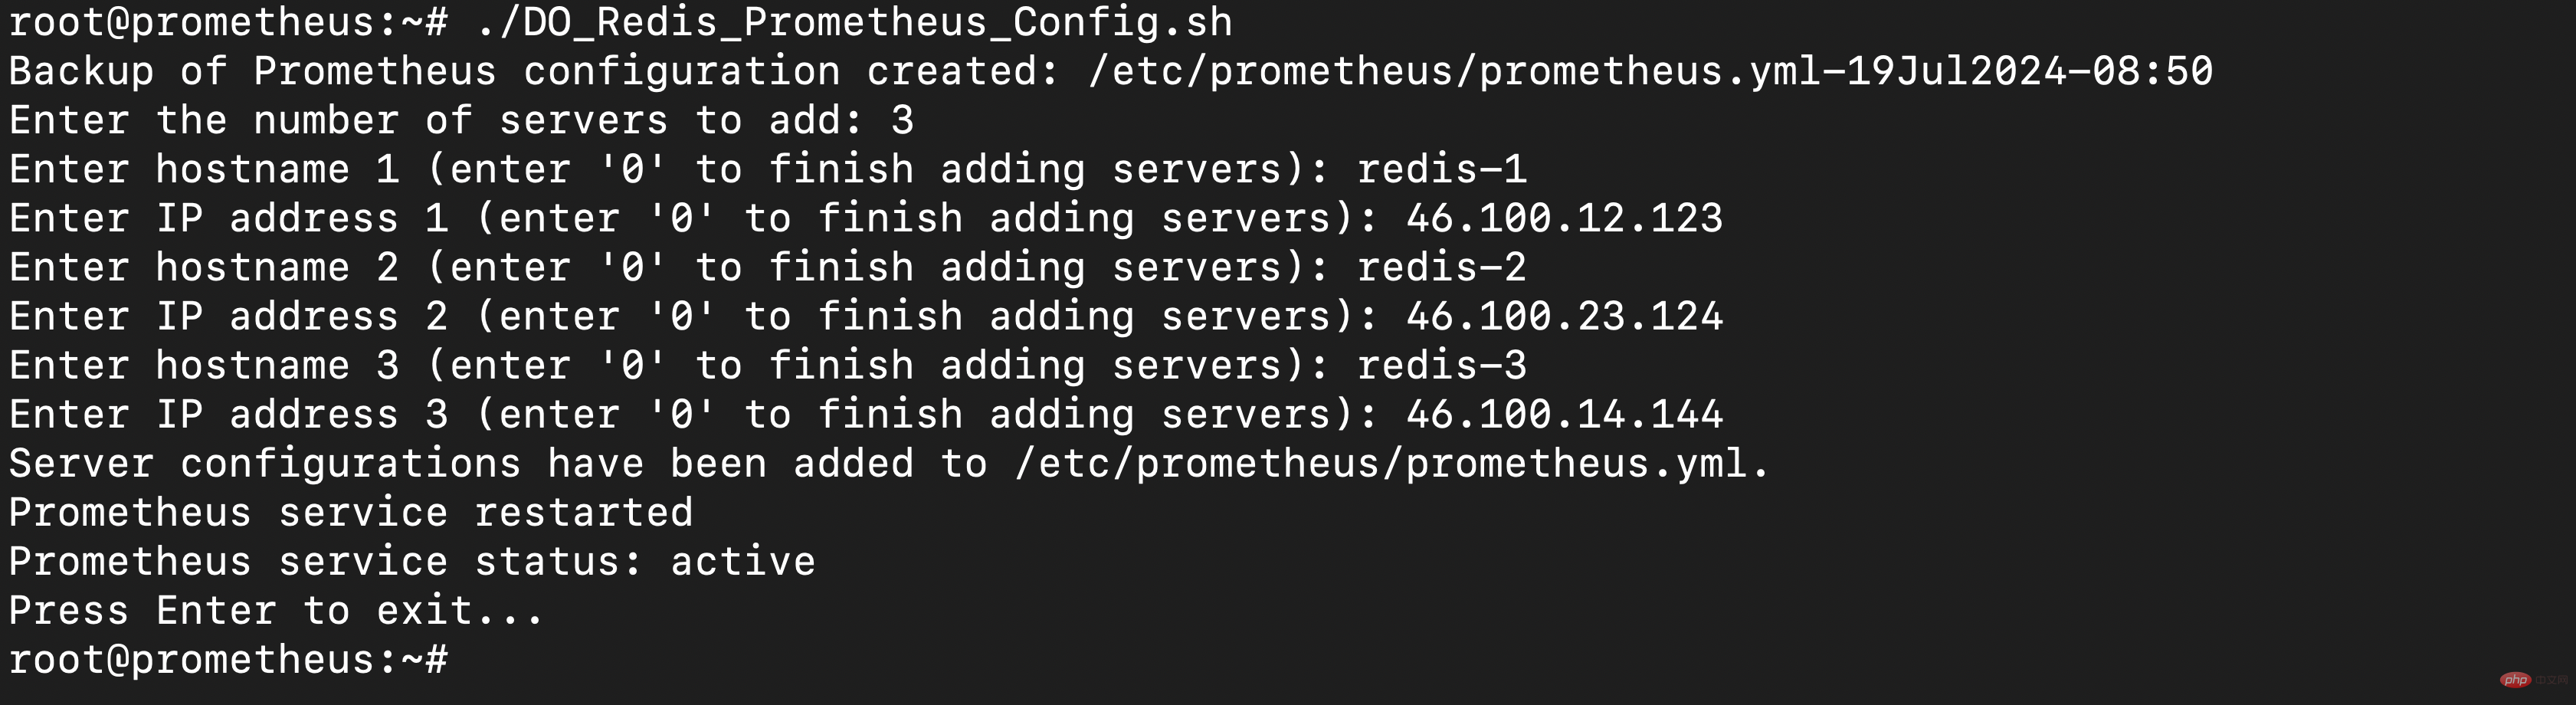
Configuration is complete.
After adding, check whether the target is updated by accessing the URL prometheushostname:9090/targets.
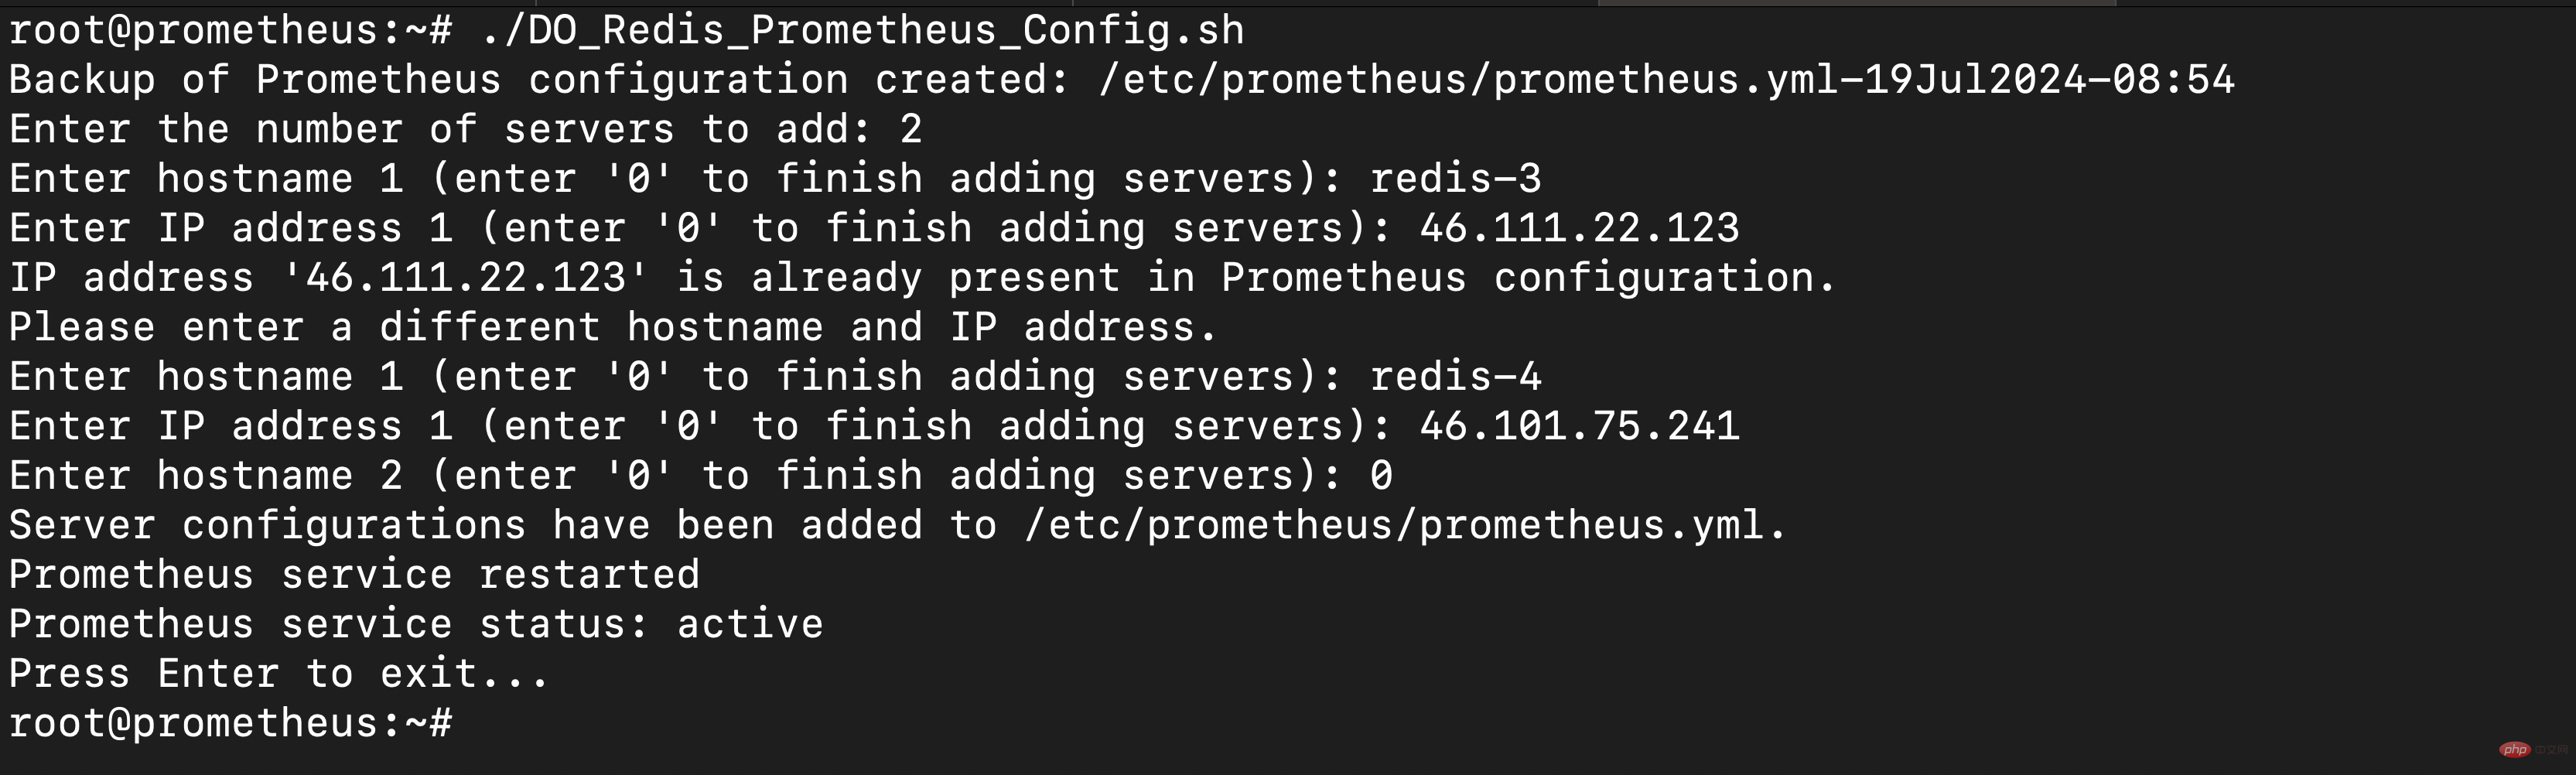
Note: If the IP address you entered has been added to the monitoring, you will be asked to enter the details again. Also, if you don't have more servers to add, you can enter 0 to exit script
Configure Grafana
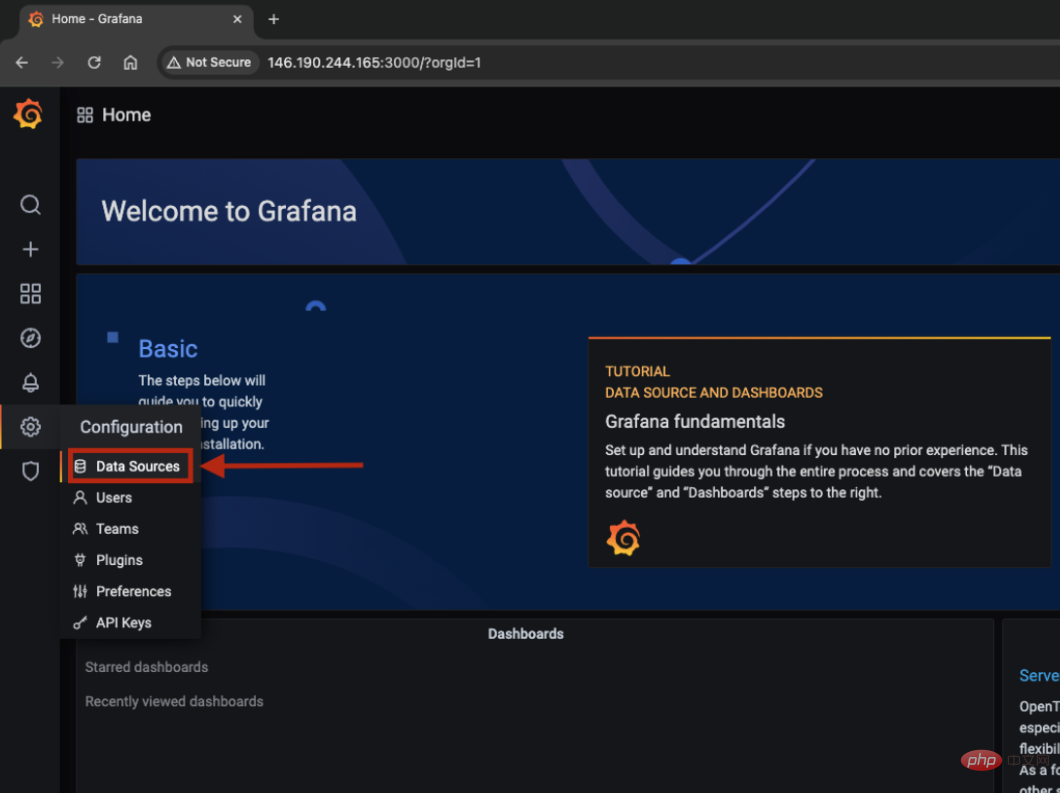
Access Grafana-IP:3000 through your browser to log in to the Grafana dashboard.
Go to Configuration > Data Source.
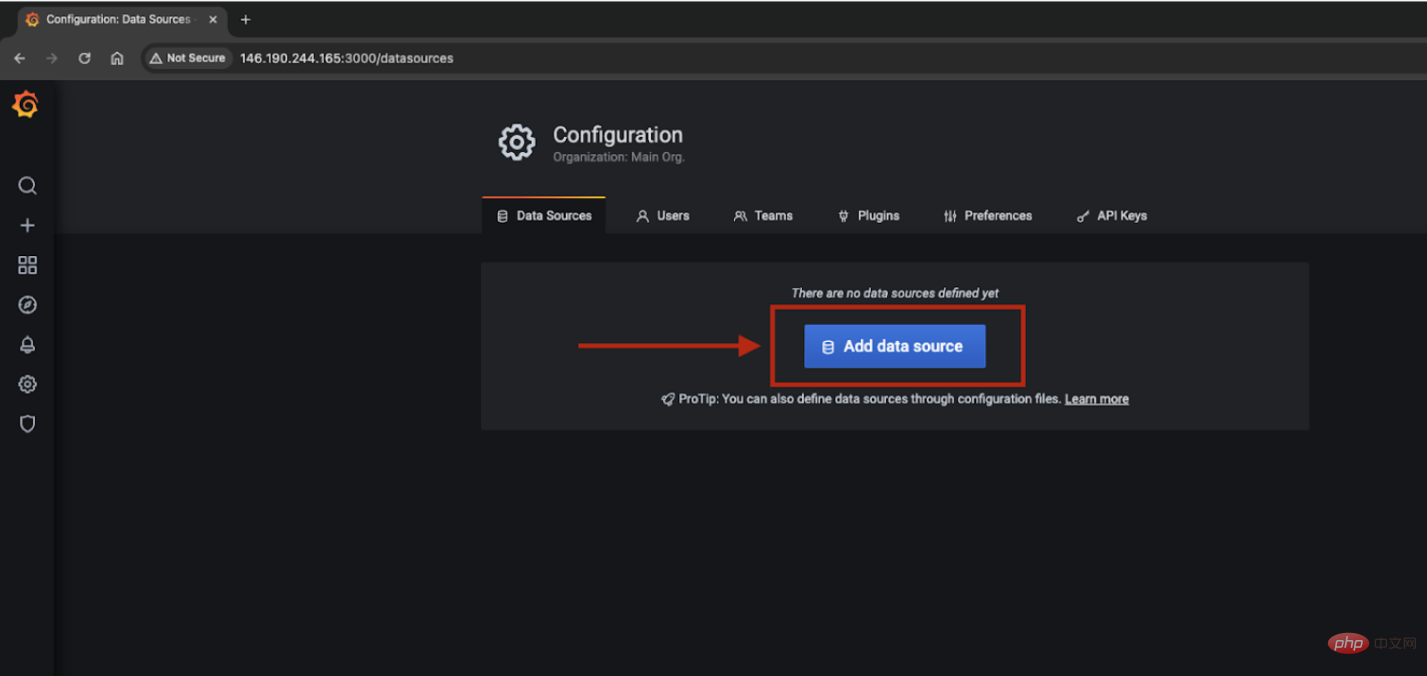
Click Add Data Source.
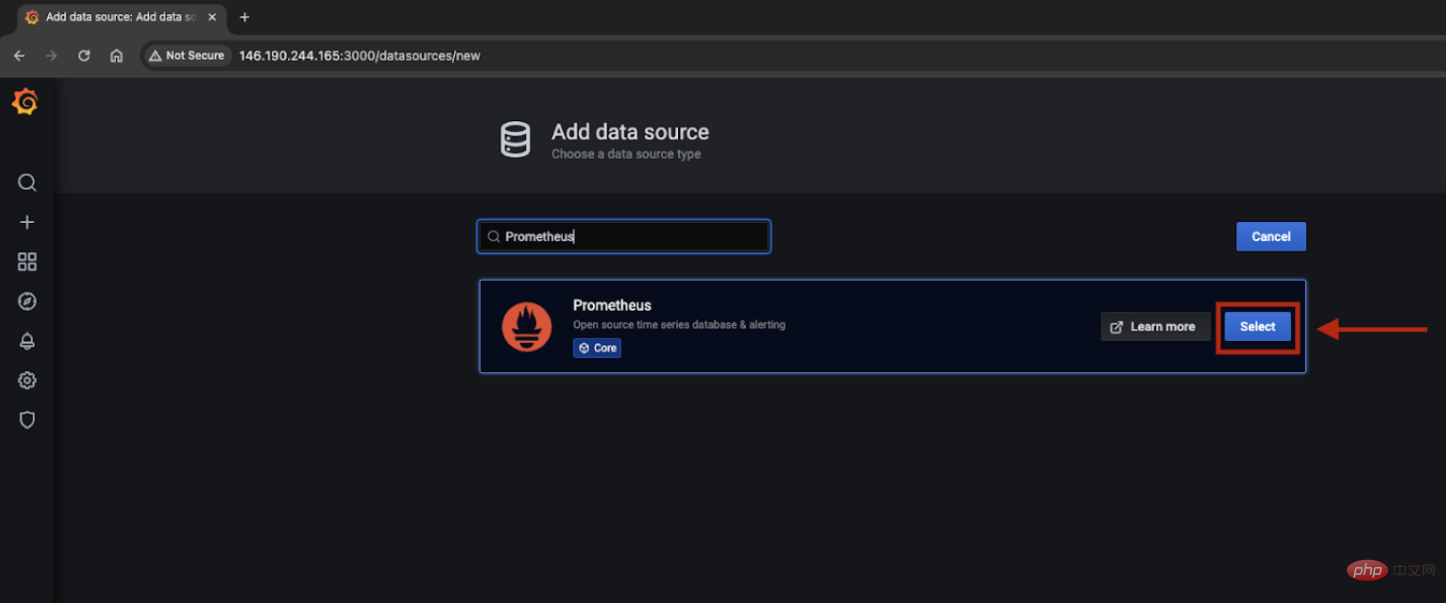
Search and select Prometheus.
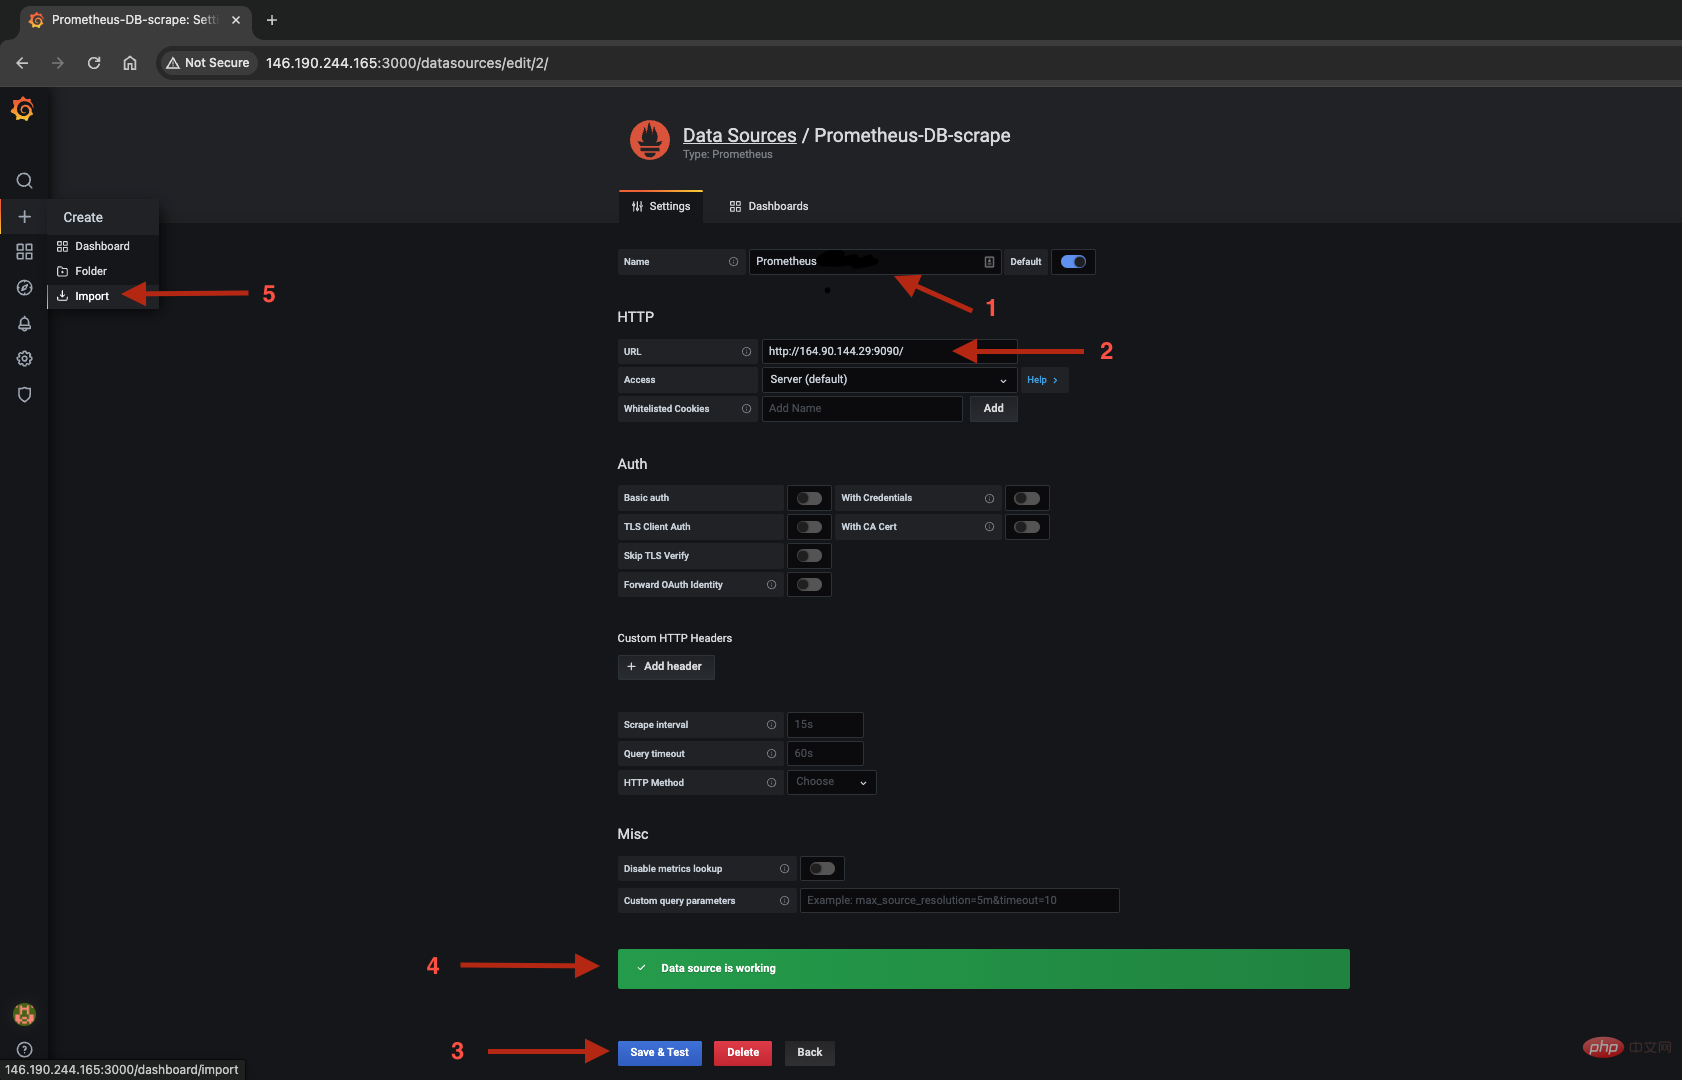
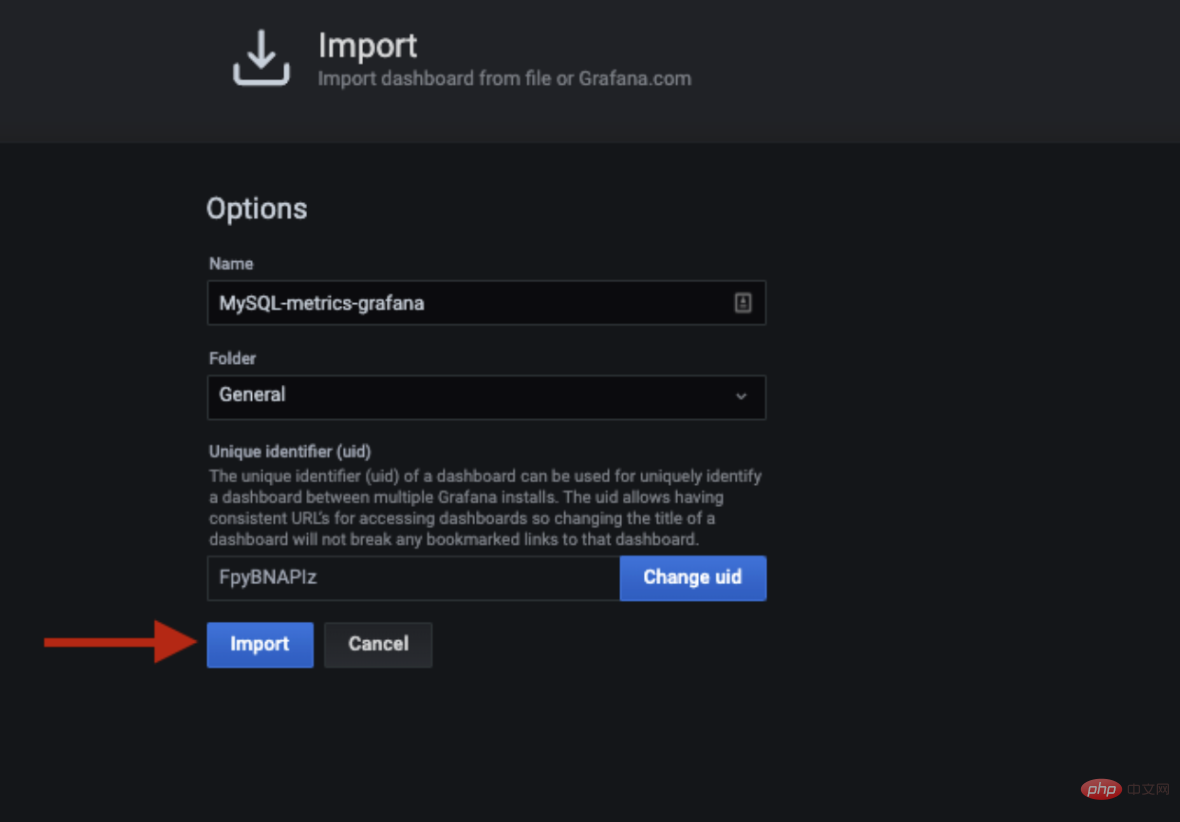
Enter the name Prometheus and URL (Prometheus hostname: 9090) and click Save and Test. If you see "Data Source is running", you have successfully added the data source. When finished, go to Create > Import.
You can configure the dashboard manually or import the dashboard to upload the JSON file by importing it through the following methods. The JSON template for Redis monitoring can be found in the following link:
https://solutions-files.ams3.digitalocianspaces.com/Redis-Monitoring/DO_Grafana-Redis_Monitoring.json
Fill in the fields and import them.
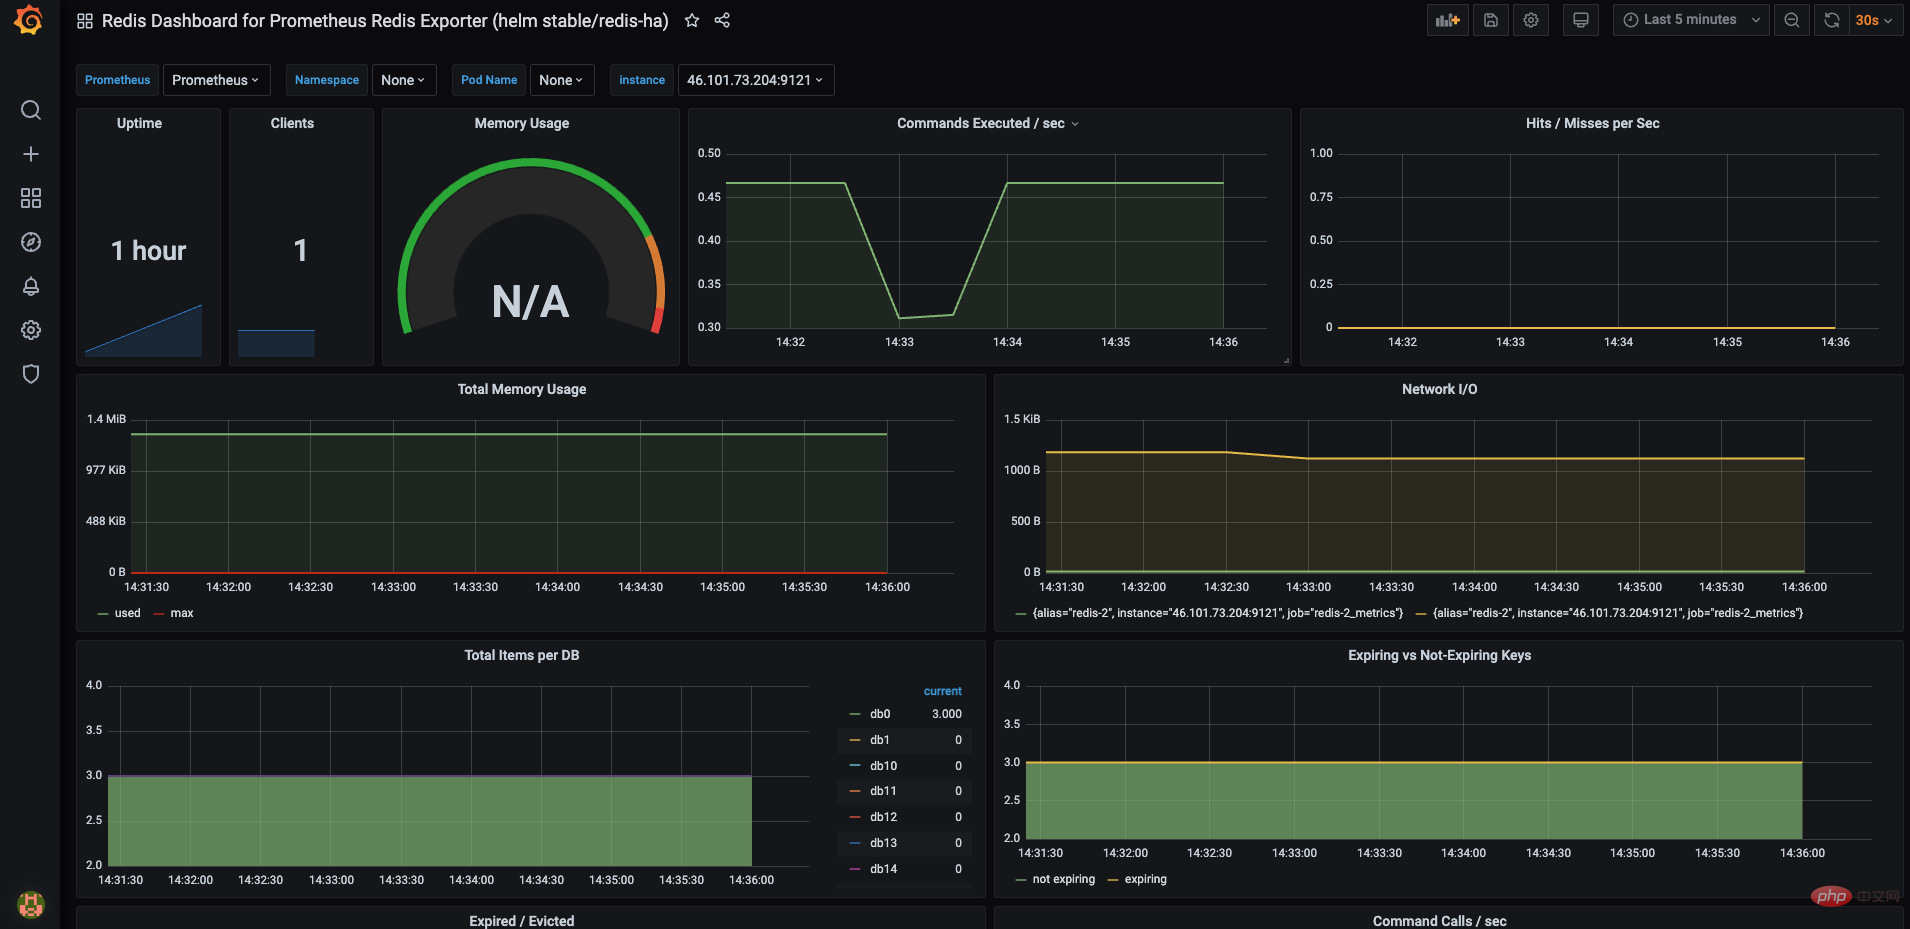
The Grafana dashboard is ready. Select the host and check if the metric is visible. Feel free to modify and edit the dashboard as needed.
The above is the detailed content of Monitor Redis Droplet with Redis Exporter Service. For more information, please follow other related articles on the PHP Chinese website!

Hot AI Tools

Undress AI Tool
Undress images for free

Undresser.AI Undress
AI-powered app for creating realistic nude photos

AI Clothes Remover
Online AI tool for removing clothes from photos.

Clothoff.io
AI clothes remover

Video Face Swap
Swap faces in any video effortlessly with our completely free AI face swap tool!

Hot Article
Hot Tools

Notepad++7.3.1
Easy-to-use and free code editor

SublimeText3 Chinese version
Chinese version, very easy to use

Zend Studio 13.0.1
Powerful PHP integrated development environment

Dreamweaver CS6
Visual web development tools

SublimeText3 Mac version
God-level code editing software (SublimeText3)
Hot Topics
 1793
1793
 16
1735
56
1585
29
267
587
16
1735
56
1585
29
267
587

 Completed python blockbuster online viewing entrance python free finished website collection
Jul 23, 2025 pm 12:36 PM
Completed python blockbuster online viewing entrance python free finished website collection
Jul 23, 2025 pm 12:36 PM
This article has selected several top Python "finished" project websites and high-level "blockbuster" learning resource portals for you. Whether you are looking for development inspiration, observing and learning master-level source code, or systematically improving your practical capabilities, these platforms are not to be missed and can help you grow into a Python master quickly.
 How to use PHP to develop a Q&A community platform Detailed explanation of PHP interactive community monetization model
Jul 23, 2025 pm 07:21 PM
How to use PHP to develop a Q&A community platform Detailed explanation of PHP interactive community monetization model
Jul 23, 2025 pm 07:21 PM
1. The first choice for the Laravel MySQL Vue/React combination in the PHP development question and answer community is the first choice for Laravel MySQL Vue/React combination, due to its maturity in the ecosystem and high development efficiency; 2. High performance requires dependence on cache (Redis), database optimization, CDN and asynchronous queues; 3. Security must be done with input filtering, CSRF protection, HTTPS, password encryption and permission control; 4. Money optional advertising, member subscription, rewards, commissions, knowledge payment and other models, the core is to match community tone and user needs.
 How much does a stablecoin cost? How much does a stablecoin cost?
Jul 23, 2025 am 06:30 AM
How much does a stablecoin cost? How much does a stablecoin cost?
Jul 23, 2025 am 06:30 AM
A stablecoin is a cryptocurrency whose value is pegged to a specific asset, and its price is usually anchored 1:1 to fiat currencies such as the US dollar. 1. Most stablecoins maintain price stability through mechanisms such as fiat currency collateral, cryptocurrency collateral or algorithmic adjustment; 2. Mainstream stablecoins such as USDT and USDC adopt fiat currency collateral; 3. DAI belong to the type of cryptocurrency over-collateralization; 4. Algorithmic stablecoins rely on smart contracts to adjust supply; 5. When querying the price of stablecoins, real-time data can be obtained through mainstream exchanges such as Binance, Ouyi, Huobi, Gate.io, Coinbase and Kraken.
 What is the blockchain confirmation time? How to query the confirmation status of transactions on the blockchain?
Jul 23, 2025 pm 11:48 PM
What is the blockchain confirmation time? How to query the confirmation status of transactions on the blockchain?
Jul 23, 2025 pm 11:48 PM
Blockchain confirmation time refers to the time it takes for a transaction to be broadcasted to be packaged by a block and written to the chain. The confirmation speeds of different chains vary. 1. Bitcoin produces blocks on average in 10 minutes, and it is recommended to confirm 6 times to ensure security; 2. Ethereum produces blocks in about 12 seconds, and 1-3 times can be confirmed, and most transactions are completed within 1 minute; 3. The BSC chain block time is about 3 seconds, suitable for high-frequency trading; 4. The TRON tide block time is 1-3 seconds, suitable for real-time transfer; 5. The Polygon block time is about 2 seconds, with low fees, and is widely used in DeFi and NFT. Trading hash (TxID) is required for query and confirmation status. Recommended platforms include: 1. Ouyi OKX, which supports multi-chain transaction query; 2. Binance, suitable for BSC chain; 3. Huobi HT
 What is the purpose of the CSS `will-change` property?
Jul 23, 2025 am 03:47 AM
What is the purpose of the CSS `will-change` property?
Jul 23, 2025 am 03:47 AM
will-change is a CSS property that is used to inform browser elements in advance of possible changes to optimize performance. Its core function is to enable the browser to create layers in advance to improve rendering efficiency. Common values include transform, opacity, etc., and can also be separated by multiple attribute commas; it is suitable for non-standard attribute animations, complex component transitions and user interaction triggered animations; but it must be avoided abuse, otherwise it will lead to excessive memory usage or increased GPU load; the best practice is to apply before the change occurs and remove it after it is completed.
 python finished blockbuster movies free viewing address python blockbuster movies online play link
Jul 23, 2025 pm 12:33 PM
python finished blockbuster movies free viewing address python blockbuster movies online play link
Jul 23, 2025 pm 12:33 PM
?For learners who want to improve their Python skills by watching full project practices, it is crucial to find high-quality free "finished" video resources. This article has compiled several top online platforms for you, which provide a large number of free Python project-based teaching videos, which can help you transform theoretical knowledge into practical capabilities and achieve the leap from entry to mastery.
 Free entrance to Vue finished product resources website. Complete Vue finished product is permanently viewed online
Jul 23, 2025 pm 12:39 PM
Free entrance to Vue finished product resources website. Complete Vue finished product is permanently viewed online
Jul 23, 2025 pm 12:39 PM
This article has selected a series of top-level finished product resource websites for Vue developers and learners. Through these platforms, you can browse, learn, and even reuse massive high-quality Vue complete projects online for free, thereby quickly improving your development skills and project practice capabilities.
 vue free finished product resource entrance vue free finished product website navigation
Jul 23, 2025 pm 12:42 PM
vue free finished product resource entrance vue free finished product website navigation
Jul 23, 2025 pm 12:42 PM
For Vue developers, a high-quality finished project or template is a powerful tool to quickly start new projects and learn best practices. This article has selected multiple top Vue free finished product resource portals and website navigation for you to help you find the front-end solutions you need efficiently, whether it is a back-end management system, UI component library, or templates for specific business scenarios, you can easily obtain them.
