


The key methods for debugging shell scripts include: 1. Use set -x or bash -x to view execution details. You can add set -x or runtime parameters to the beginning of the script to display each execution command and its parameters to help locate problems; 2. Check whether the variable is empty or assigned errors, print the variables through echo, use ${VAR_NAME:?} to force check whether the variable exists, and pay attention to the correct use of quotes to avoid parsing errors; 3. Add error handling logic to improve robustness, such as using set -e to exit immediately, combine the trap command to clean or record, and handle exceptions on important commands; 4. Use the shellcheck tool to discover potential problems in advance, and run shellcheck script.sh after installation to recognize syntax errors, spelling problems and bad practices. Mastering these techniques can significantly improve the efficiency and code quality of Shell script debugging.

Debugging shell scripts is actually not mysterious. As long as you master a few key methods, you can quickly locate problems. When a shell script errors, detailed error information is usually not given, so some skills are needed to "see" the execution process of the script.
1. Use set -x or bash -x to view execution details
This is the most direct way to debug. At the beginning of the script:
set -x
Or add the -x parameter when running the script:
bash -x script.sh
This allows Bash to output the actual commands and parameters of each line, so that you can see the result after variable replacement and which line has a problem.
Tip: If you only want to see the execution of a certain piece of code, you can add
set -xandset xbefore and after that part to temporarily enable debugging.
2. Check whether the variable is empty or the assignment error is
Many shell scripts have problems with variables. For example, variables are not assigned, quotation marks are used improperly, path splicing is incorrect, etc.
You can troubleshoot by:
Print the variable before it is used:
echo "Variable value is: $VAR_NAME"
Use
${VAR_NAME:?}to force check whether the variable exists. If it is empty or undefined, an error will be reported.Pay attention to the use of quotes to avoid spaces causing command parsing errors:
 # Error example (when $FILE_NAME contains spaces)
cp $FILE_NAME /backup/

# Correct writing method cp "$FILE_NAME" /backup/
3. Add error handling logic to improve robustness
By default, the shell script will continue to execute when encountering an error, which may cause further errors in subsequent steps. You can make the script more "smart" in the following ways:
At the beginning of the script:
set -e
In this way, once a command returns a non-0 status code, the script will exit immediately to prevent errors from spreading.
Cooperate with
trapcommand to clean up or log records:trap 'echo "The script errors in line $LINENO"; exit' ERR
Add judgments on important commands:
 if ! grep "pattern" file.txt; then
  echo "Specified content not found"
  exit 1
fi
4. Use shellcheck tool to discover potential problems in advance
Shell does not check for syntax errors before running, like compiled languages. At this time, you can use the static check tool shellcheck :
Use after installation:
shellcheck script.sh
It can help you spot grammatical errors, recommend best practices, and point out possible pitfalls, such as:
- No quotes are added when using
[ ] - Used a deprecated combination of commands
- Variable name misspelling
Basically that's it. Although shell scripts are simple, they are easy to cause headaches when debugging because of the lack of strong type and strict error prompt mechanisms. However, as long as you make good use of the above methods, most problems can be located and solved quickly.
The above is the detailed content of How to debug a shell script?. For more information, please follow other related articles on the PHP Chinese website!

Hot AI Tools

Undress AI Tool
Undress images for free

Undresser.AI Undress
AI-powered app for creating realistic nude photos

AI Clothes Remover
Online AI tool for removing clothes from photos.

Clothoff.io
AI clothes remover

Video Face Swap
Swap faces in any video effortlessly with our completely free AI face swap tool!

Hot Article
Hot Tools

Notepad++7.3.1
Easy-to-use and free code editor

SublimeText3 Chinese version
Chinese version, very easy to use

Zend Studio 13.0.1
Powerful PHP integrated development environment

Dreamweaver CS6
Visual web development tools

SublimeText3 Mac version
God-level code editing software (SublimeText3)
Hot Topics


 How to solve the problem of invalid debugging when setting breakpoints in SpringBoot project
May 11, 2023 am 10:49 AM
How to solve the problem of invalid debugging when setting breakpoints in SpringBoot project
May 11, 2023 am 10:49 AM
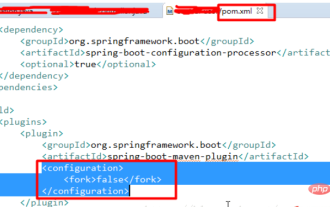
I am new to the springboot project. (1) I found that breakpoint debugging was ineffective. I was very depressed and searched for solutions online. All I saw were some very complicated solutions, which were said to be remote debugging, but also required additional opening slogans. This is different from a traditional project, so I don’t think it’s necessary. So after some exploration, I found that there is a simpler way. The steps are as follows: Add a configuration in the plugin part of the pom file: false and it will be ok; (2) Regarding the error in the SpringBoot project that the web.xml file is missing, because Traditional web projects require web.xml files, but SpringBoot projects do not require web.xml files.
 Take you to debug Nestjs project in VSCode (tutorial)
Apr 24, 2023 pm 05:53 PM
Take you to debug Nestjs project in VSCode (tutorial)
Apr 24, 2023 pm 05:53 PM
Friends who have used Vscode to write projects such as Node all know that if we want to troubleshoot a problem, we mostly print it through console.log to see where the problem is. If the problem involved is more complex, we will choose Through Vscode...
 UCIe 2.0: Advancing the open chiplet ecosystem with 3D packaging and manageability
Aug 08, 2024 pm 12:51 PM
UCIe 2.0: Advancing the open chiplet ecosystem with 3D packaging and manageability
Aug 08, 2024 pm 12:51 PM
The Universal Chiplet Interconnect Express (UCIe) Consortium has announced the release of the UCIe 2.0 specification, further advancing the open chiplet ecosystem. The latest specification introduces several key enhancements. First, it adds support f
 How to effectively deal with overflow problems
Jan 27, 2024 am 09:39 AM
How to effectively deal with overflow problems
Jan 27, 2024 am 09:39 AM
How to Correctly Deal with Overflow Problems Overflow is a common computer programming problem, especially when dealing with numbers or arrays. Overflow occurs when we try to store a value that exceeds the allowed range of the data type. The key to solving this problem lies in correctly handling and validating data boundaries. Several common overflow problems and corresponding solutions will be introduced below. Integer overflow Integer overflow means that during calculation, the result exceeds the representation range of the integer type. For example, in the 32-bit signed integer type in
 How to use IDEA remote connection Debug in springboot
May 10, 2023 pm 11:55 PM
How to use IDEA remote connection Debug in springboot
May 10, 2023 pm 11:55 PM
1. First create a Demo ready for remote debugging. Pay attention to the configuration of the build project 4.0.0org.springframework.bootspring-boot-starter-parent2.1.4.RELEASEcom.remote.testremote_test0.0.1-SNAPSHOTremote_testDemoprojectforSpringBoot1.8org.springframework.bootspring-boot- starterorg.springframework.bootspring-bo
 What is the method of debugging in Python?
Apr 29, 2023 pm 09:01 PM
What is the method of debugging in Python?
Apr 29, 2023 pm 09:01 PM
The test code used in this article: fromtorchvisionimporttransformsfromtorchvision.datasetsimportFashionMNISTimportosos.environ["KMP_DUPLICATE_LIB_OK"]="TRUE"#Dataset preparation train_data=FashionMNIST(root="./data/FashionMNIST",train=True,transform=transforms.
 How to use Nocalhost and enable debugging in Python
May 14, 2023 pm 03:16 PM
How to use Nocalhost and enable debugging in Python
May 14, 2023 pm 03:16 PM
Nocalhost is a developer tool that supports debugging and deployment of Kubernetes applications. Using Nocalhost for Python development requires completing the following steps: Install Nocalhost CLI. It can be installed through the installation package provided by Nocalhost official website. Configure the Kubernetes cluster and install the Nocalhost plugin. You can refer to the guidance provided in Nocalhost official documentation. Install the Python interpreter and debugger on the local computer, such as Python's own pdb or third-party libraries pudb, ipdb, etc. Create a Python project and add the debugger calling statement to the code,
 How to debug code in PHP
May 23, 2023 pm 05:40 PM
How to debug code in PHP
May 23, 2023 pm 05:40 PM
When developing PHP applications, you often encounter situations where you need to debug code. Debugging is a necessary step to troubleshoot program problems, find errors in your code, and improve program performance. In PHP, debugging is done using a debugger. This article will introduce how to use the debugger to debug code in PHP. 1. Configure the debugging environment. Before starting debugging, you need to configure the debugging environment. The purpose of configuring the debugging environment is to enable the debugger to run to help you debug your code. There are two main types of PHP debuggers: XDebug and ZendDebug
