Found a total of 10000 related content

Chart drawing beyond border: What is the reason? How to solve it?
Article Introduction:Common reasons and solutions for chart drawing beyond borders and how to solve the problem of chart drawing. When using the chart library for data visualization, you often encounter the chart content exceeding the preset container edge...
2025-04-05
comment 0
593

What is the analysis chart of Bitcoin finished product structure? How to draw?
Article Introduction:The steps to draw a Bitcoin structure analysis chart include: 1. Determine the purpose and audience of the drawing, 2. Select the right tool, 3. Design the framework and fill in the core components, 4. Refer to the existing template. Complete steps ensure that the chart is accurate and easy to understand.
2025-04-21
comment 0
333

How do I use matplotlib for creating visualizations in Python?
Article Introduction:How to use Matplotlib includes installing imports, creating charts, adding tags, customizing styles, drawing different chart types and saving charts. 1. Install and import: Use pipinstallmatplotlib to install, import through importmatplotlib.pyplotasplt, and use %matplotlibinline to display the image in JupyterNotebook; 2. Create a chart: Use plt.plot(x,y) to draw a basic line chart; 3. Add labels: Use plt.title(), plt.xlabel(), and plt.ylabel() to add title and axis labels to the chart; 4.
2025-06-23
comment 0
843
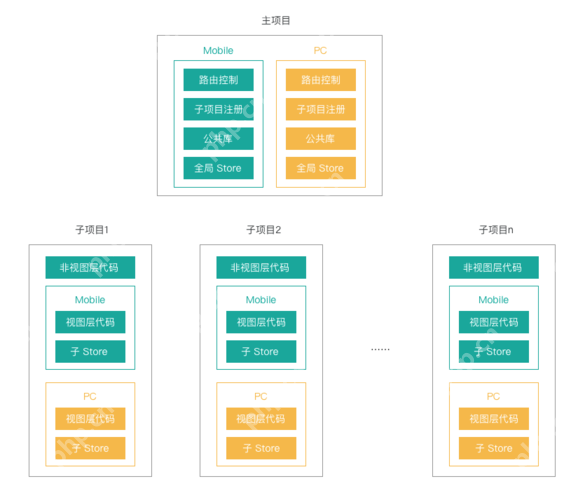
How to use ECharts to enable data visualization in front-end projects?
Article Introduction:Using ECharts to implement data visualization mainly includes the following steps: 1. Install the ECharts library through npm or yarn; 2. Create a chart container in HTML; 3. Initialize the ECharts instance in JavaScript and configure chart options; 4. Optimize the performance of large data volume, such as data paging, data sampling and using WebGL; 5. Add chart interactivity, such as listening to click events; 6. Use the connect function to achieve multiple chart linkage. ECharts is a powerful and flexible chart library that meets most data visualization needs.
2025-05-20
comment 0
327

How to use echarts for bootstrap
Article Introduction:How to use Bootstrap with ECharts To integrate Bootstrap with ECharts, you can follow these steps: Install the Bootstrap and the ECharts library. Create a chart container. Initialize an ECharts instance. Set chart options. Call render() method to render the chart. Advantages of using Bootstrap and ECharts: Responsive design custom style interactive data visualization
2025-04-07
comment 0
414
Data Visualization Techniques Using Python Matplotlib/Seaborn
Article Introduction:Master the key techniques for data visualization, Matplotlib and Seaborn can efficiently present data. 1. Select the appropriate chart type: line chart displays trends, bar chart/bar chart is used for classification comparison, scatter chart observes variable relationships, heat map displays correlation, box chart view distribution and outliers, Seaborn high-level interface automatically matches the types. 2. Improve readability: add clear labels, adjust font size, reasonable color matching, set legend position, and use grid lines to assist in reading. 3. Combining the advantages of both: use Seaborn to quickly draw, Matplotlib adjusts details such as style, layout, export high-definition pictures and avoid overlap. 4. Pay attention to common problems: manually set the axis range, solve Chinese garbled code, and control drawing rules
2025-07-07
comment 0
178

How to Create a Stacked Bar Chart in Pandas with Grouped Data?
Article Introduction:This article presents a solution for creating a stacked bar chart using the Pandas library in Python. The main issue addressed revolves around arranging data from separate columns into a stacked format and then plotting the chart with Pandas. The sol
2024-10-21
comment 0
381


Effective diagram maker: how to make a diagram
Article Introduction:Charts are a great way to convey complex information concisely and clearly. Many people find it easier to understand information when data is presented in graph form or in a way that reduces reading.
One important reason people use charts is that they help others understand a lot of data quickly. A reliable chart making application can help you create chart models that are beneficial to all viewers.
Not all charts are equal and even useful in any case. There are some commonly used types, but there are also some niche charts that may be more useful.
Here we will discuss popular chart types, how to make charts, drawing software for Mac, and the best options for chart tools for you.
Commonly used chart types
There are reasons why the most common chart types are popular:
2025-04-21
comment 0
241
Rotate charts in Excel - spin bar, column, pie and line charts
Article Introduction:This article will guide you how to rotate a chart in Excel. You'll learn how to rotate bar charts, bar charts, pie charts, and line charts, including their 3D variants. Additionally, you will learn how to reverse the drawing order of values, categories, series, and legends. For users who frequently print charts, this article will also introduce how to adjust the printing direction of a worksheet. Excel makes it very easy to represent table data as a chart or graph. You just select the data and click on the appropriate chart type icon. However, the default settings may not meet your needs. If your task is to rotate a chart in Excel to rearrange slices, bars, bars, or line charts of a pie chart, this article will help you. - Rotate the pie chart to any angle
- Rotating 3D diagram
2025-05-19
comment 0
694

An easy-to-understand explanation of how to create a flowchart in ChatGPT!
Article Introduction:A guide to creating a flow chart using ChatGPT: Visualize complex information!
Flowcharts are a powerful tool to organize and visually understand complex information. However, hand-made work requires time and effort. That's where ChatGPT comes in! In this article, we'll explain step-by-step how to easily create a flow chart using ChatGPT. In addition, we will also introduce various examples of use.
Creating a flow chart with ChatGPT: Two ways
There are two main ways to create a flow chart in ChatGPT.
M
2025-05-16
comment 0
402
Visualize Your Data And Speed Up Your Site With Dynamic Chart Libraries
Article Introduction:Create a data visual interface that combines aesthetics and efficiency. Designers should strive to create interfaces that are not only visually attractive, but also flexible and efficient. Data visualization should strike a balance between aesthetics and practicality.
Dynamic Chart Library provides a practical solution for data visualization, allowing real-time updates, interactivity, and significantly reducing page loading time for a smoother user experience.
There are a variety of dynamic chart libraries to choose from, each with its pros and cons, including HighCharts, PlotKit, d3.js, FusionCharts, Google Chart Tools, and Flot. These libraries range from simple, free to powerful and expensive.
Dynamic chart library can process large amounts of data and supports various charts
2025-02-27
comment 0
534


