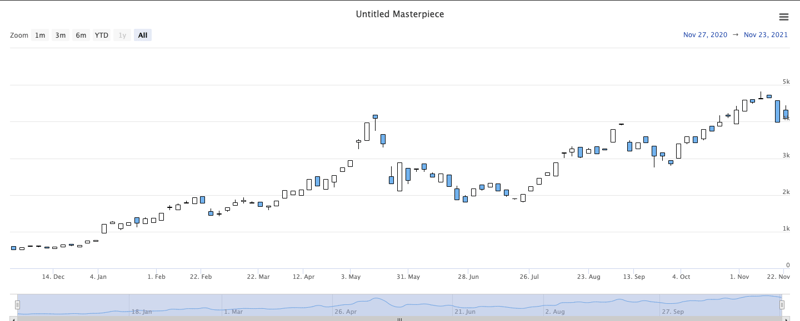
Course Introduction:Comprehensive Guide to JavaScript Graph Visualization LibrariesDetermining the Optimal Library for Your NeedsWhen selecting a graph visualization...
2024-12-14 comment 0 612

Course Introduction:LIDA: Automating Data Visualization and Infographic Creation LIDA is a powerful tool designed to automate the creation of visualizations and infographics. It handles data interpretation, visualization goal identification, and detailed specification
2025-04-08 comment 0 1103

Course Introduction:Data visualization is a powerful tool for modern data analysts, transforming raw data into insightful visual narratives. This guide explores the world of data visualization within the robust Ubuntu Linux environment, covering setup, tool selection,
2025-03-06 comment 0 1006

Course Introduction:This tutorial demonstrates building a data visualization app using Vue.js and D3.js to display GitHub issues. It leverages D3.js's capabilities for DOM manipulation and data visualization to create an interactive bar chart. The application allows u
2025-02-14 comment 0 495
Course Introduction:What is Data Visualization? Data visualization is the practice of representing data/information in pictorial or graphical formats. It is a means by which large data sets or metrics are converted into visual elements like maps, graphs, and c
2024-12-31 comment 0 325

Course Intermediate 5038
Course Introduction:There are two main purposes for studying this course: 1. Visual panel layout adapts to the screen 2. Use ECharts to realize histogram display Core Technology: -Based on flexible.js + rem smart large screen adaptation - VScode cssrem plug-in - Flex layout - Less to use - Based on ECharts data visualization display - ECharts histogram data settings - ECharts map introduction

Course Elementary 2629
Course Introduction:Python visualization video series using matplotlib, seaborn, pyecharts, combined with real data sets; this video is reproduced from Bilibili: BV1gz411v7F5
Course Elementary 13861
Course Introduction:Material collection: https://gitee.com/xiaoqiang001/java-script.git 1. JavaScript basics from the definition and use of variables, flow control statements, arrays, functions, constructors, built-in objects and objects, etc. 2. Web API explains how to obtain DOM elements, how to operate DOM elements, BOM operations, and create web page special effects on mobile terminals. 3. Later there will be advanced js, ES6 object-oriented syntax, object-oriented cases, prototypes and prototype chains, etc. 4. jquery comprehensive + echarts data visualization

Course Intermediate 9112
Course Introduction:With the popularization of big data and the popularity of artificial intelligence, data visualization is widely used in existing enterprises and the demand is relatively strong, so we have this set of data visualization courses. This course is very suitable for students who have learned the basics of Vue as a cool practice project. After studying this course, whether it is applied in the current job or during the job interview, it will be a big plus point.

Course Elementary 3610
Course Introduction:Reprinted from Bilibili: https://www.bilibili.com/video/BV1Ja411c74f
The mongoDB visualization software mongoVUE cannot be opened?
2017-05-02 09:24:27 0 2 1103
2022-12-25 23:49:52 0 1 971
2017-06-12 09:31:52 0 2 895
Want to use python for data analysis
2019-06-19 10:31:07 0 1 1719
