
 web3.0
What does the crypto circle pin mean? Why did it suddenly plummet and then pull back? Analysis of abnormal fluctuations
web3.0
What does the crypto circle pin mean? Why did it suddenly plummet and then pull back? Analysis of abnormal fluctuations
What does the crypto circle pin mean? Why did it suddenly plummet and then pull back? Analysis of abnormal fluctuations
Jul 11, 2025 pm 08:36 PM
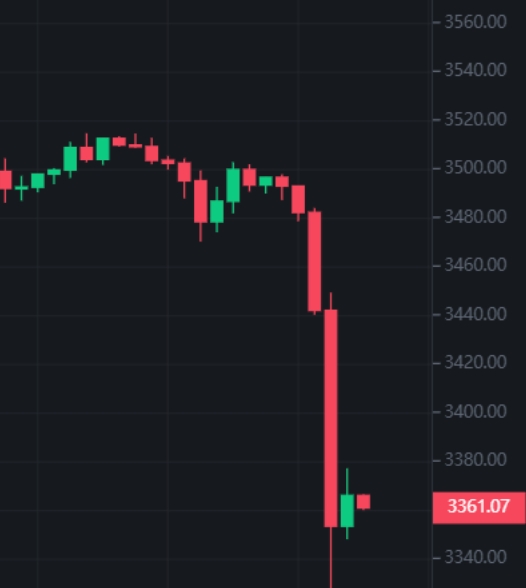
In the cryptocurrency trading market, "pin" is a common K-line chart phenomenon. It refers to the price falling or rising in a very sharp time in a very short period of time, and then quickly rebounded back to near the original price, eventually leaving a long and thin "shadow" on the chart, which looks like a needle. This price change with a huge fluctuation range and a very short duration usually represents an abnormal trading behavior or liquidity situation in the market at a certain moment. This phenomenon often confuses many traders because it is not like a regular market trend or adjustment.
This sudden price plunge and rapid pullback may involve the interaction of multiple complex market factors. Understanding these factors is very important for analyzing this abnormal fluctuation. It is not a simple imbalance of buying and selling power, but a manifestation of the fragility of market structure under certain specific conditions. Observing the timing and location of these "pins" can sometimes provide some clues about potential market pressure.
Possible reasons for the sudden plunge
1. The instant trigger of a large number of orders sold. When there are sudden negative news in the market, or if a giant whale (individual or institution holding a large amount of digital currency) executes large-scale sell orders in a short period of time, the buy orders in the market are not enough to be accepted instantly, resulting in a sharp and rapid price decline.
2. Chain reaction of high leverage trading. In high-leverage transactions such as contracts, a slight decline in price will trigger the forced liquidation (liquidation) of some highly leveraged positions. The exchange system will automatically sell these closed positions at the market price, further aggravating the selling pressure and forming a chain reaction, resulting in a spiral decline in the price.
3. The market depth is insufficient. In some trading pairs, or during a specific time period, the number of pending orders in the market is relatively small and liquidity is insufficient. At this time, a relatively large sell order may quickly "eat" all the buy orders on the market, causing the price to jump down within a very large range.
Explanation of the rapid price pullback
1. The existence of a large number of low-priced orders. Many traders will preset low-priced buying limit orders, or decisively enter the market to buy at the bottom when the price falls rapidly. When the price falls to these dense or large-scale paying areas, the selling pressure is quickly absorbed and the price begins to gain support and rebound.
2. Buying power after the liquidation. The price decline triggers short profit closing (buy) or longs being forced to close (sell), but when the price falls and reaches a lower buy order, the active buying force appears, and some shorts may recoup their positions, which jointly drives the price to rebound.
3. Rapid changes in market sentiment. The initial panic sell-off could be based on inadequate or wrong information. When market participants react and find that the situation is not as bad as expected, or think that the price drop is too large, buying will quickly emerge, correcting the previous excessive decline.
The impact of trading platform mechanism
1. The speed and efficiency of the match engine. When the exchange's matchmaking system processes a large number of orders, its speed and algorithm design will affect price slippage and execution effect. During extreme fluctuations, matching delays or abnormal handling may aggravate the "pin" phenomenon.
2. The behavior of liquidity providers. The strategies of market makers and major liquidity providers in extreme market conditions will significantly affect the market's rebound ability. They may quickly replenish their purchases at low levels to help prices return to normal.
3. The role of the risk control system. While triggering forced closing, the exchange's risk control system may also play a role after the price returns to stability, such as adjusting margin requirements, indirectly affecting market sentiment and trading behavior, although the effect of directly driving a price rebound is not as strong as buying orders.
The above is the detailed content of What does the crypto circle pin mean? Why did it suddenly plummet and then pull back? Analysis of abnormal fluctuations. For more information, please follow other related articles on the PHP Chinese website!

Hot AI Tools

Undress AI Tool
Undress images for free

Undresser.AI Undress
AI-powered app for creating realistic nude photos

AI Clothes Remover
Online AI tool for removing clothes from photos.

Clothoff.io
AI clothes remover

Video Face Swap
Swap faces in any video effortlessly with our completely free AI face swap tool!

Hot Article
Hot Tools

Notepad++7.3.1
Easy-to-use and free code editor

SublimeText3 Chinese version
Chinese version, very easy to use

Zend Studio 13.0.1
Powerful PHP integrated development environment

Dreamweaver CS6
Visual web development tools

SublimeText3 Mac version
God-level code editing software (SublimeText3)


 How to download the Binance official app Binance Exchange app download link to get
Aug 04, 2025 pm 11:21 PM
How to download the Binance official app Binance Exchange app download link to get
Aug 04, 2025 pm 11:21 PM
As the internationally leading blockchain digital asset trading platform, Binance provides users with a safe and convenient trading experience. Its official app integrates multiple core functions such as market viewing, asset management, currency trading and fiat currency trading.
 Binance official app download latest link Binance exchange app installation portal
Aug 04, 2025 pm 11:24 PM
Binance official app download latest link Binance exchange app installation portal
Aug 04, 2025 pm 11:24 PM
Binance is a world-renowned digital asset trading platform, providing users with secure, stable and rich cryptocurrency trading services. Its app is simple to design and powerful, supporting a variety of transaction types and asset management tools.
 Ouyi Exchange APP Android version v6.132.0 Ouyi APP official website download and installation guide 2025
Aug 04, 2025 pm 11:18 PM
Ouyi Exchange APP Android version v6.132.0 Ouyi APP official website download and installation guide 2025
Aug 04, 2025 pm 11:18 PM
OKX is a world-renowned comprehensive digital asset service platform, providing users with diversified products and services including spot, contracts, options, etc. With its smooth operation experience and powerful function integration, its official APP has become a common tool for many digital asset users.
 Binance official app latest official website entrance Binance exchange app download address
Aug 04, 2025 pm 11:27 PM
Binance official app latest official website entrance Binance exchange app download address
Aug 04, 2025 pm 11:27 PM
Binance is one of the world's well-known digital asset trading platforms, providing users with safe, stable and convenient cryptocurrency trading services. Through the Binance App, you can view market conditions, buy, sell and asset management anytime, anywhere.
 Binance (BINANCE) contract to launch ALL 75x composite index U-standard perpetual contract
Aug 06, 2025 pm 06:48 PM
Binance (BINANCE) contract to launch ALL 75x composite index U-standard perpetual contract
Aug 06, 2025 pm 06:48 PM
Table of Contents About Binance ALL Comprehensive Index About Binance ALL Comprehensive Index Fixed-point adjustment component mechanism The newly launched U-standard perpetual contract with USDT quoted U-standard perpetual contract The Binance Contract is scheduled to officially launch the ALL75 times comprehensive index U-standard perpetual contract at 17:00 on August 6, 2025 (East Eighth District time). About Binance ALL Comprehensive Index Binance Exchange: Official Registration Official Download Binance ALL Comprehensive Index is designed to track the performance of all U-standard perpetual contracts denominated in USDT on the Binance Contract Platform, but the following types of contracts are not included: ETHBTC perpetual contracts quoted using USDC or other stablecoins U-standard delivery contracts All comprehensive index perpetual contracts are permanent
 Solana (SOL Coin) Price Forecast: 2025-2030 and Future Outlook
Aug 06, 2025 pm 08:42 PM
Solana (SOL Coin) Price Forecast: 2025-2030 and Future Outlook
Aug 06, 2025 pm 08:42 PM
Table of Contents Solana's Price History and Important Market Data Important Data in Solana Price Chart: 2025 Solana Price Forecast: Optimistic 2026 Solana Price Forecast: Maintain Trend 2026 Solana Price Forecast: 2030 Solana Long-term Price Forecast: Top Blockchain? What affects the forecast of sun prices? Scalability and Solana: Competitive Advantages Should you invest in Solana in the next few years? Conclusion: Solana's price prospects Conclusion: Solana has its excellent scalability, low transaction costs and high efficiency
 What is the download address of Anbi Exchange app? The latest official download portal of Anbi App
Aug 04, 2025 pm 11:15 PM
What is the download address of Anbi Exchange app? The latest official download portal of Anbi App
Aug 04, 2025 pm 11:15 PM
Anbi Exchange is a world-renowned digital asset trading platform, providing users with secure, stable and convenient cryptocurrency trading services. Through the Anbi App, you can view market conditions, manage digital assets, and conduct transactions of multiple coin pairs anytime, anywhere.
 What is a parabolic SAR indicator? How does SAR indicator work? Comprehensive introduction to SAR indicators
Aug 06, 2025 pm 08:12 PM
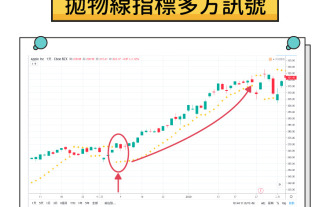
What is a parabolic SAR indicator? How does SAR indicator work? Comprehensive introduction to SAR indicators
Aug 06, 2025 pm 08:12 PM
Contents Understand the mechanism of parabola SAR The working principle of parabola SAR calculation method and acceleration factor visual representation on trading charts Application of parabola SAR in cryptocurrency markets1. Identify potential trend reversal 2. Determine the best entry and exit points3. Set dynamic stop loss order case study: hypothetical ETH trading scenario Parabola SAR trading signals and interpretation Based on parabola SAR trading execution Combining parabola SAR with other indicators1. Use moving averages to confirm trend 2. Relative strength indicator (RSI) for momentum analysis3. Bollinger bands for volatility analysis Advantages of parabola SAR and limitations Advantages of parabola SAR